Swaps data: cleared volumes and CCP market share
Data shows CME and Eurex growing faster than LCH Swapclear

All in all, it’s been a topsy-turvy first quarter of 2019. The US Federal Reserve first paused and then ultimately halted its rate rises. Meanwhile, after a series of bruising votes, the chances of an orderly Brexit hang by a thread.
Those machinations have pulled global swap volumes in opposing directions. Cleared US dollar swap volumes are down 14% on a year ago, while euro swaps volumes are 35% higher.
Looking at the market share of clearing houses, a different theme emerges. While LCH continues to dominate both US dollar and euro interest rate swap clearing, its rivals are gaining ground.
Cleared US dollar swaps
Let’s start with the largest product: cleared US dollar interest rate swaps. We include all clearable types – vanilla fixed versus float, overnight index, basis, zero coupon and variable – and look at single-sided gross notional volumes.
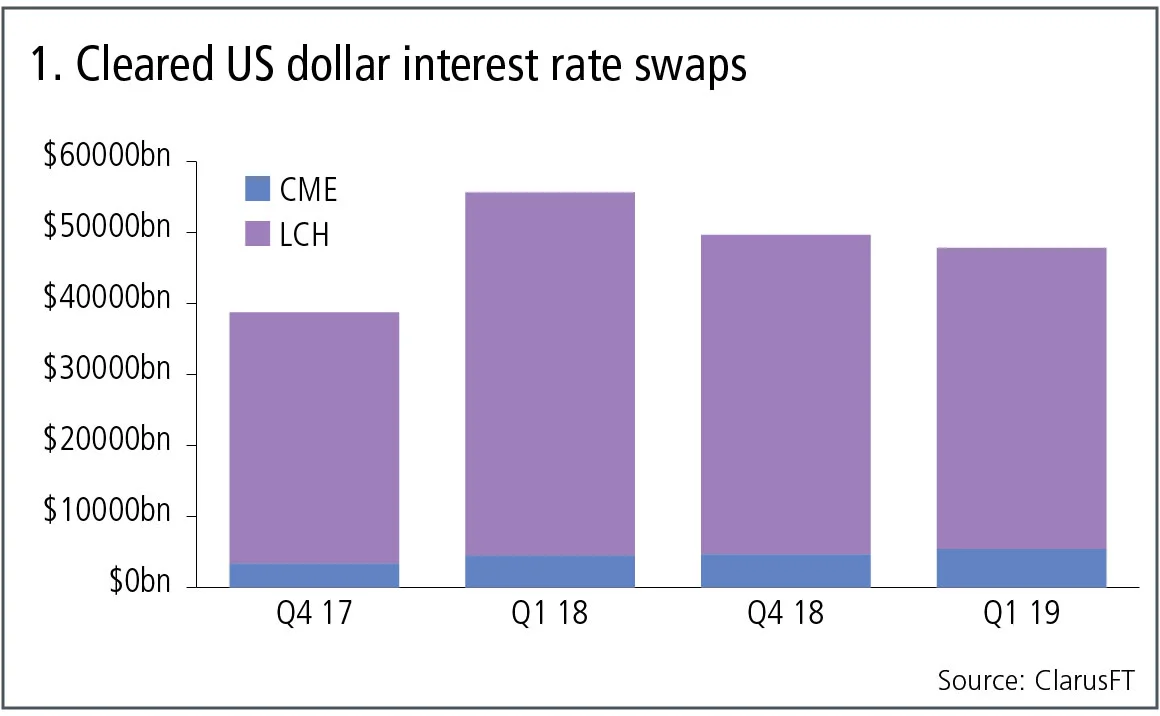
Figure 1 shows:
- Q1 2019 volumes at $48 trillion are 14% lower than the $55.5 trillion in Q1 2018, a very different trend to Q4 2018, which was much higher than Q4 2017.
- LCH SwapClear with 89% share and CME with 11%, in the most recent quarter.
- LCH SwapClear is down 17% from a year earlier, February 2019 was a particularly low month.
- CME is up 20% in the most recent quarter from a year earlier.
The halt in Federal Reserve rate rises for 2019, has certainly resulted in lower US dollar swaps volume at LCH, while CME has bucked the trend with an up quarter.
Cleared euro swaps
Next, the second-largest product: cleared euro interest rate swaps, all clearable types.
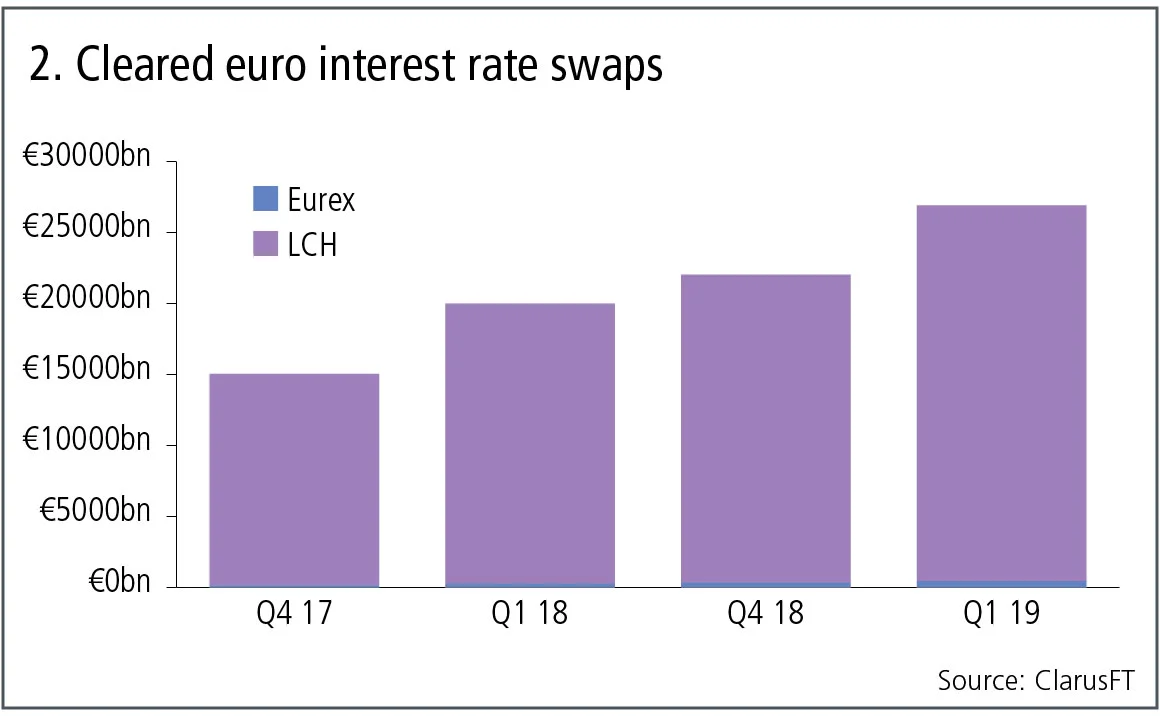
Figure 2 shows:
- Q1 2019 volumes at €27 trillion ($30 trillion) are 35% higher than the €20 trillion in Q1 2018.
- LCH SwapClear with 98.3% share and Eurex with 1.7% in the most recent quarter.
- LCH SwapClear up 34% in Q1 2019 from a year earlier.
- Eurex up 83% in Q1 19 with €454 billion of single-sided gross notional.
LCH SwapClear continues its dominance in euro swap volumes, but with Eurex growing at more than double the rate from a low base.
Cleared yen swaps
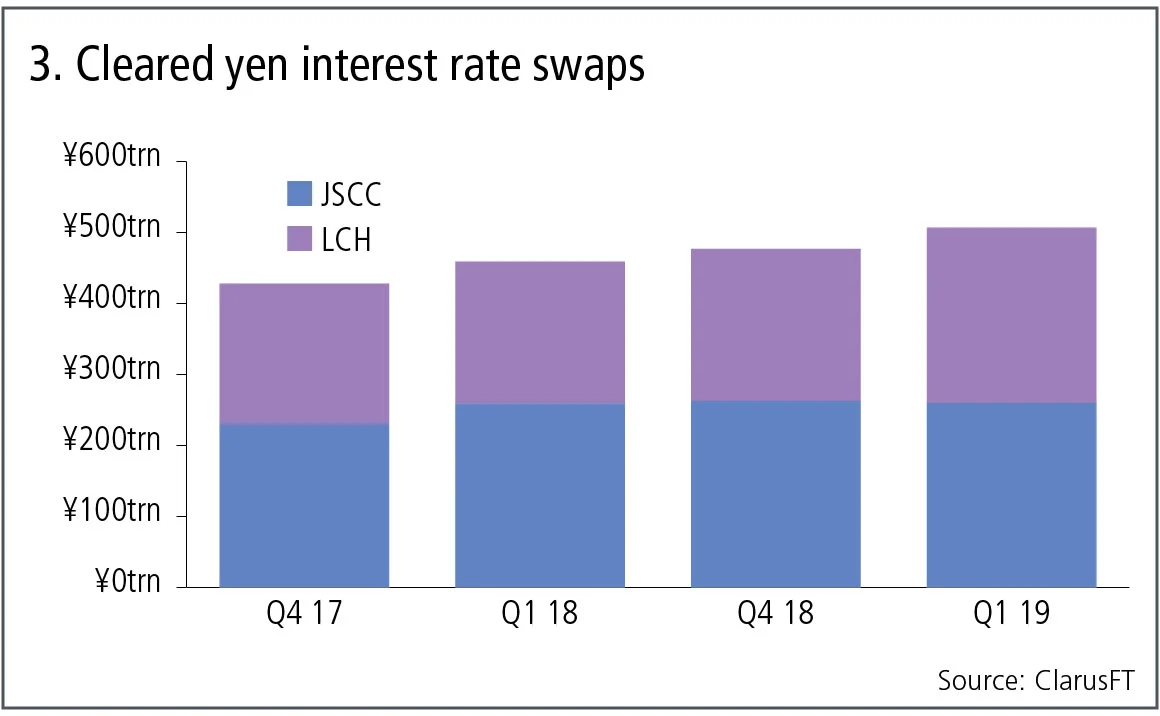
Figure 3 shows:
- Q1 2019 at ¥507 trillion ($4.56 trillion) is 11% higher than the ¥459 trillion a year earlier.
- JSCC with 51% share and LCH SwapClear with 49% in the most recent quarter, which is a 4% shift in LCH’s favour compared to Q4 2018.
- JSCC volume in the most recent quarter is the same as a year earlier.
- LCH is up 24% in Q1 2019 from a year earlier.
So, continuing growth in cleared yen swaps with market share evenly split between JSCC and LCH.
Cleared US dollar credit default swaps
Let’s now switch focus to credit derivatives and the volume of credit indexes and single names in US dollars.
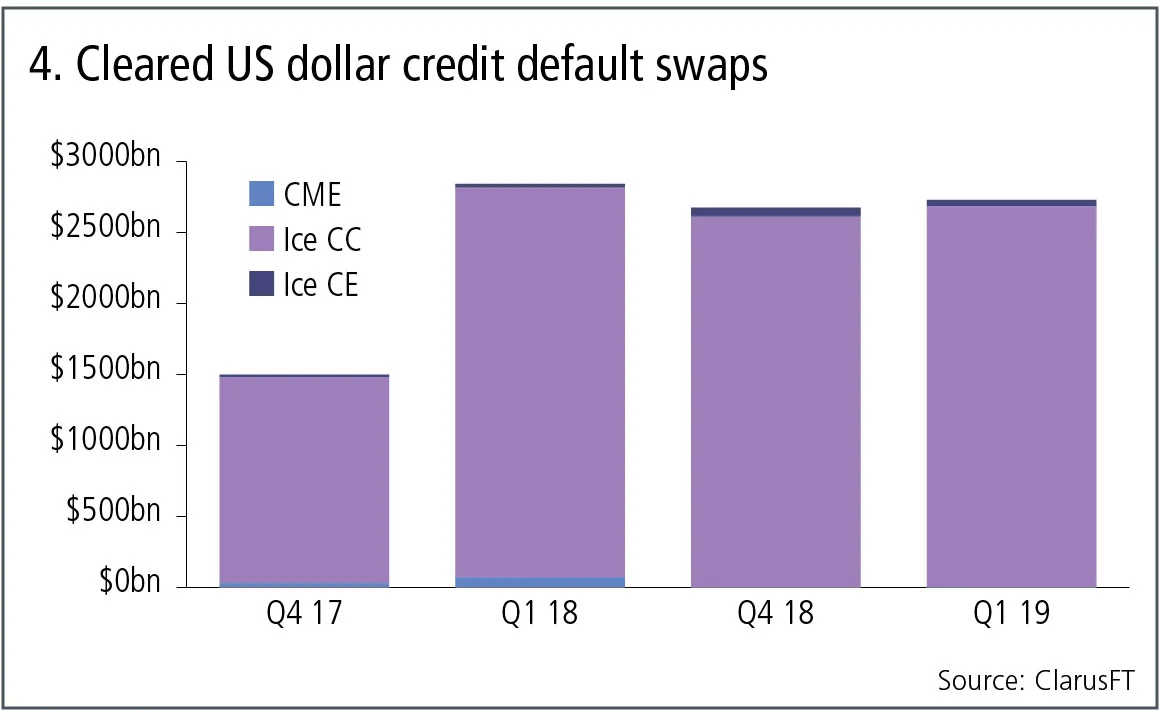
Figure 4 shows:
- Q1 2019 volumes at $2.7 trillion are 4% lower than the $2.8 trillion in Q1 2018, a very different trend to Q4 2018, which was much higher than Q4 2017.
- Ice Credit Clear dominates with 98% share.
- Ice Clear Europe is up from a year earlier with $46 billion in Q1 2019.
- CME shutting down its service.
- LCH CDS with $3 billion in Q1 2019.
Cleared credit derivatives volumes in US dollars slightly down in the most recent quarter.
Cleared euro credit default swaps
Next, the volume of credit indexes and single names in euro.
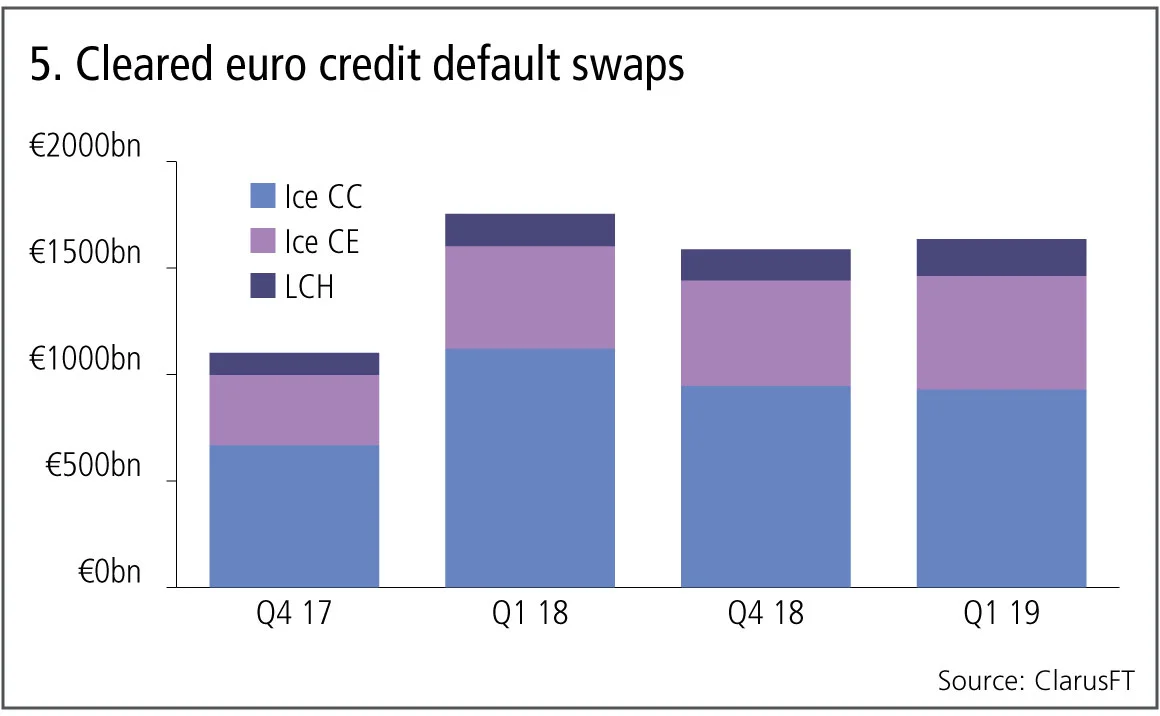
Figure 5 shows:
- Q1 2019 volumes at €1.65 trillion are 7% lower than the €1.75 trillion in Q1 2018, a very different trend to Q4 2018, which was much higher than Q4 2017.
- Ice Credit Clear with 56.8% share, Ice Clear Europe 32.6% and LCH CDSClear with 10.6% in the most recent quarter.
- Ice Credit Clear down 17% from a year earlier.
- Ice Clear Europe up 11% and LCH CDSClear up 13%.
Cleared credit derivatives volumes in euros is slightly down in the most recent quarter.
Cleared non-deliverable forwards
Finally cleared non-deliverable forwards.
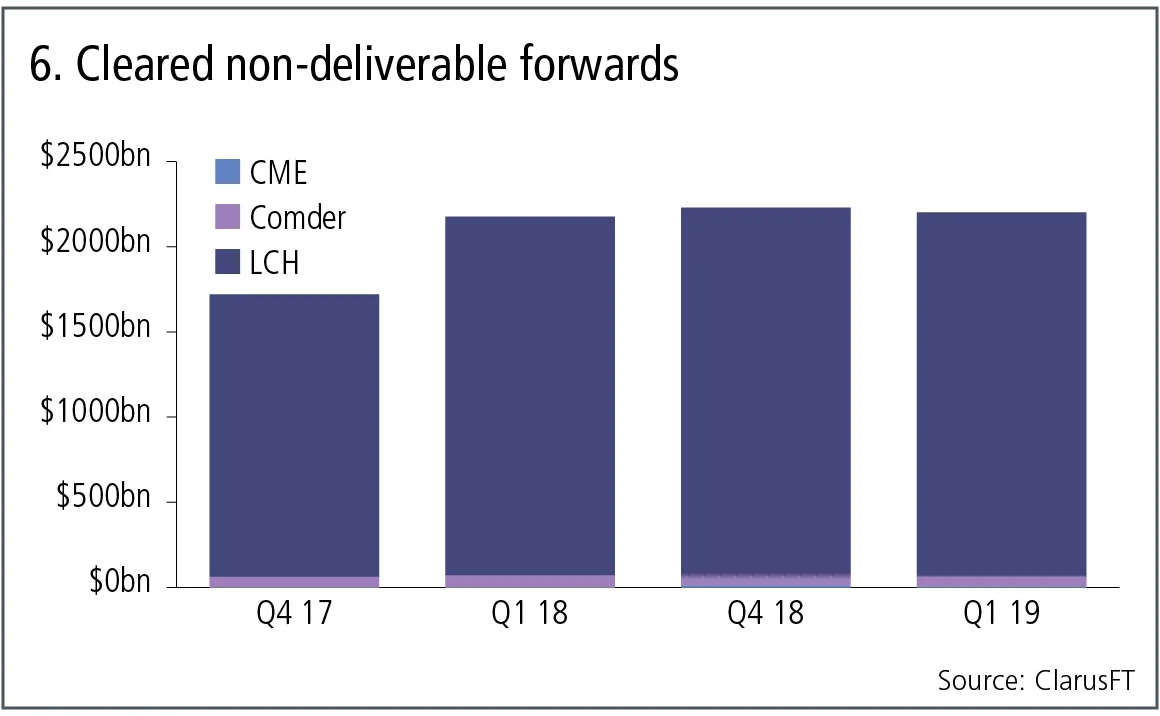
Figure 6 shows:
- Q1 2019 volumes at $2.2 trillion are 1% higher than Q1 2018,
- a very different trend to Q4 2018, which was 30% higher
- than Q4 2017.
- LCH ForexClear with 97.1% share in the quarter.
- Comder with 2.7%.
- CME with volume from Q4 18 onwards, with $5 billion in Q1 19 for a 0.2% share in the quarter.
Cleared non-deliverable forwards volumes no longer show their long-running trend of high growth rates. Is this a pause before a further ramp-up later in the year when phase four of the uncleared margin rules takes effect in September 2019? Or will we have to wait until the lead-up to September 2020 and phase five of the UMR for the next growth spurt in non-deliverable forward volumes?
Only time will tell.
Amir Khwaja is chief executive of Clarus Financial Technology.
Only users who have a paid subscription or are part of a corporate subscription are able to print or copy content.
To access these options, along with all other subscription benefits, please contact info@risk.net or view our subscription options here: http://subscriptions.risk.net/subscribe
You are currently unable to print this content. Please contact info@risk.net to find out more.
You are currently unable to copy this content. Please contact info@risk.net to find out more.
Copyright Infopro Digital Limited. All rights reserved.
As outlined in our terms and conditions, https://www.infopro-digital.com/terms-and-conditions/subscriptions/ (point 2.4), printing is limited to a single copy.
If you would like to purchase additional rights please email info@risk.net
Copyright Infopro Digital Limited. All rights reserved.
You may share this content using our article tools. As outlined in our terms and conditions, https://www.infopro-digital.com/terms-and-conditions/subscriptions/ (clause 2.4), an Authorised User may only make one copy of the materials for their own personal use. You must also comply with the restrictions in clause 2.5.
If you would like to purchase additional rights please email info@risk.net
More on Markets
Euronext, LCH back Esma as exchange super-regulator
Fragmented regulatory regime puts Europe at a disadvantage to the US, exchange officials say - but some are not ready to accept a single watchdog

FactSet’s Portware expands to tackle complex FX
EMS vendor eyes automation for high-touch FX trades while adding connectivity to new venues

Treasury basis trade loses its allure as returns shrink
Tight spreads and rising funding costs are pushing the cash-futures basis trade out of favour

How vol eruption blew up Goldman’s rates book
Dealers were short payer skew from corporate and hedge fund flows. Then came the Iran war.

XTX Markets’ US sales head joins rival IMC Trading
Benjamin Klixball takes up new role at Dutch prop trader in New York

Hong Kong biotech: from niche exposure to broader product ecosystem
Hong Kong’s biotech market is maturing from a niche thematic allocation into a broader capital markets proposition

Doubts swirl over future of FX cartel case
Group of banks accused of manipulation have filed for the class action to be dismissed

Liquidity on Kalshi, Polymarket ‘too thin’ for institutional use
Patchy trade flows cause outsize market impact for financial events, research from Risk.net shows