
Swaps data: cleared volumes drop for all markets – except FX
Smaller CCPs make market share gains in a quarter of double-digit declines for rates and credit

Longstanding growth in cleared over-the-counter derivatives volumes came to an abrupt halt in the fourth quarter of 2019, as all products other than foreign exchange posted double-digit declines compared with the same quarter in 2018.
Volumes of interest rate swaps in dollars and euros dropped 27% and 19% respectively, while credit default swap volumes in dollars and euros were down 35% and 27%. It could just be a blip, as data for the period January 2 to February 21, 2020, shows a recovery with volumes largely similar to the equivalent period in 2019. Foreign exchange non-deliverable forwards stand out as the only product where volumes actually increased in the fourth quarter of 2019 compared with a year earlier, though the 5% growth rate is anaemic compared to prior quarters.
Amid the drop in activity, some interesting market share developments emerged, as smaller players eked out gains. The standout swing came at Eurex, which increased its share in euro interest rate swaps from 1.7% to 5.5%. In credit markets, LCH CDSClear increased its share in euro credit default swaps from 12.8% to 16.5%.
Cleared US dollar swaps
Let’s start with the largest product – cleared US dollar interest rate swaps. We include all clearable types – vanilla fixed versus float, overnight index, basis, zero coupon and variable notional – and use single-sided gross notional volumes.
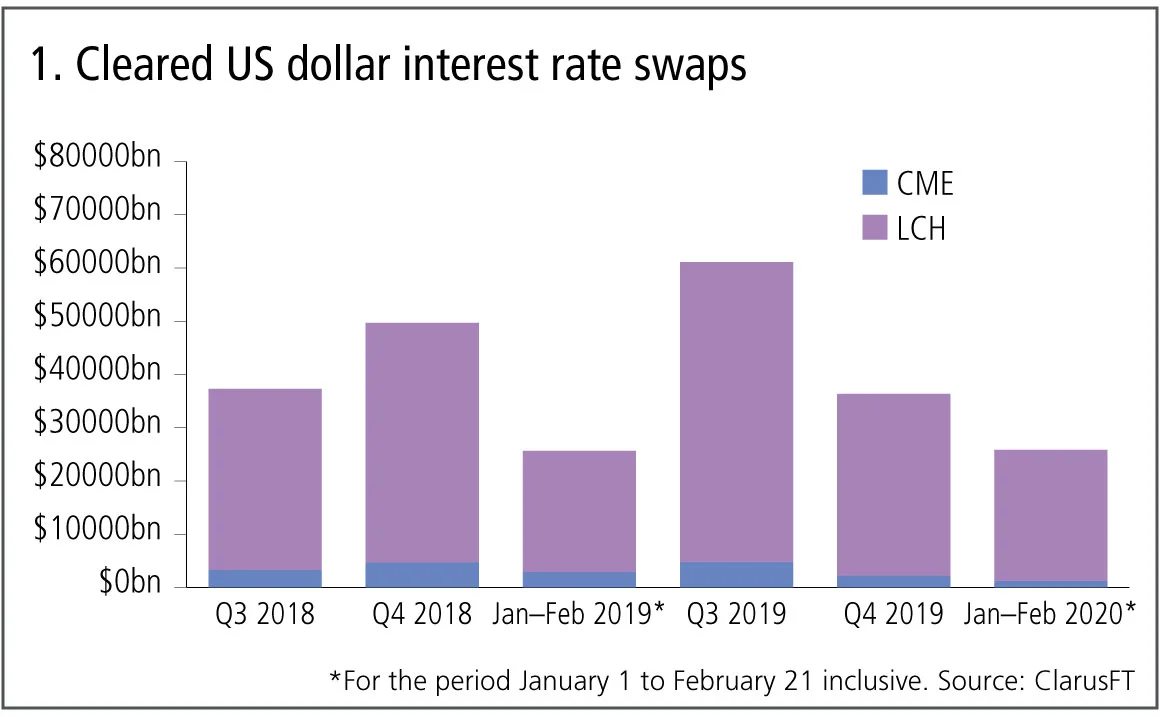
Figure 1 shows:
- Q4 2019 volumes at $36 trillion are 27% lower than a year earlier and 40% lower than Q3 2019.
- Volumes in the period January 1 to February 21, 2020, are 1% higher than the corresponding period in 2019.
- LCH SwapClear with a 94% share in Q4 2019, up from a 92% share in Q3 2019, and CME with 6%, down from 8%.
- LCH SwapClear down $10.8 trillion or 24% from a year earlier.
- CME down $2.5 trillion or 53% from a year earlier.
The much lower volumes in the fourth quarter of 2019 is a real contrast to the large gains we saw in the second and third quarters of 2019, while the early signs in 2020 are that the first quarter will be similar to the corresponding quarter a year earlier.
Cleared euro swaps
Next, cleared euro interest rate swaps, all clearable types.
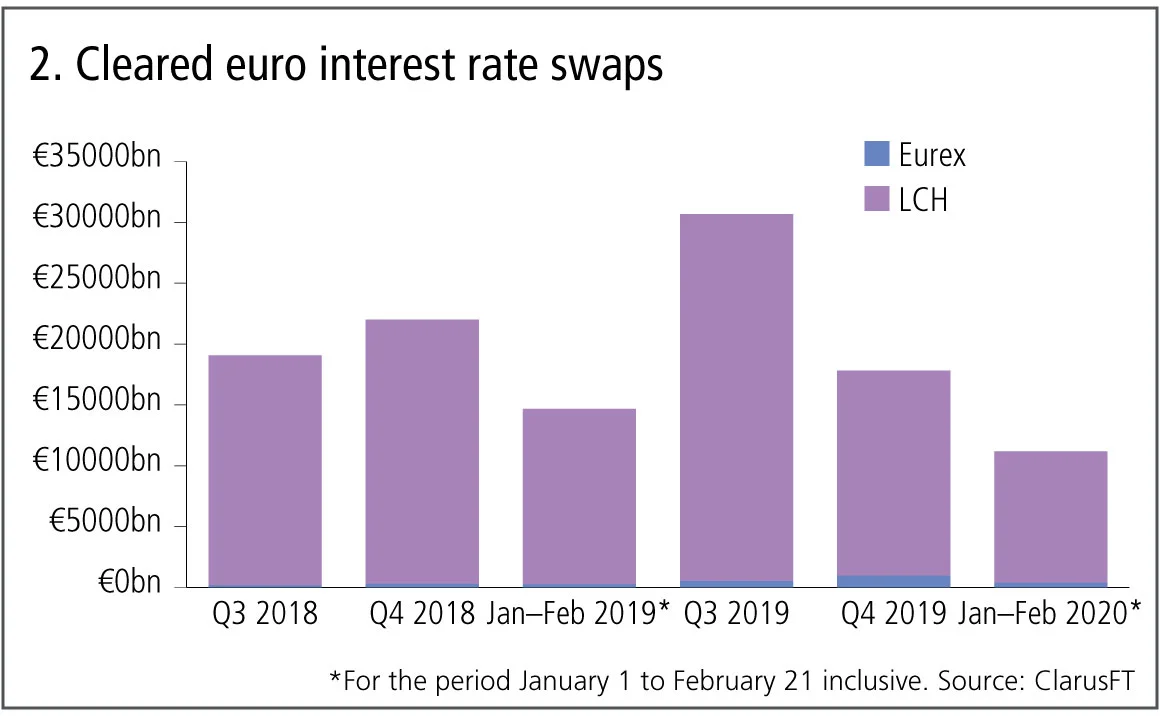
Figure 2 shows:
- Q4 2019 volumes at €18 trillion ($20 trillion) are 19% lower than a year earlier and 42% lower than Q3 2019.
- Volumes in the period January 1 to February 21, 2020, are 24% lower than the corresponding period in 2019.
- LCH SwapClear with 94.5% share in Q4 2019, down from 98.3% share in Q3 2019 and Eurex with 5.5% share up from 1.7%, though in the early part of 2020, this is down to 3.3%.
- LCH SwapClear is down 22%, or €4.9 trillion from a year earlier.
- Eurex is up 224% or €0.7 trillion from a year earlier.
Euro volumes are showing similar drops to US dollar volumes, while Eurex continues its high growth rates with its share increasing from 1.7% to 5.5% between the third quarter and fourth quarters of 2019.
Cleared yen swaps
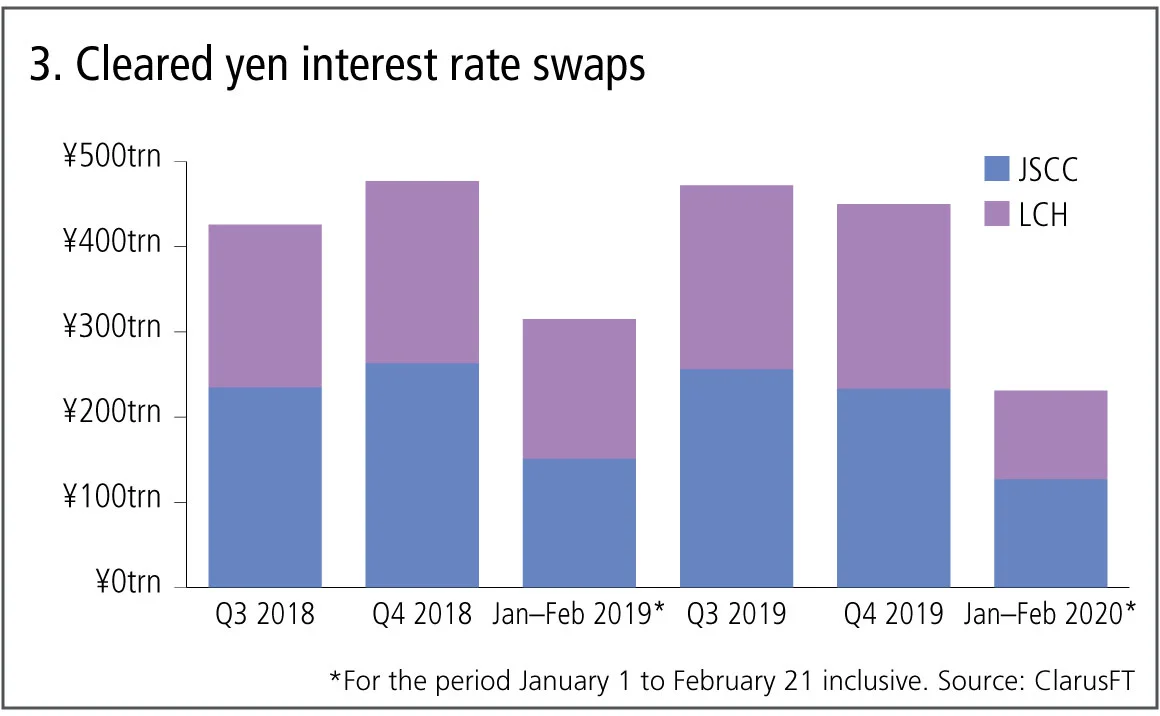
Figure 3 shows:
- Q4 2019 volumes at 450 trillion yen ($4.17 trillion) are 6% lower than a year earlier and 5% lower than Q3 2019.
- Volumes in the period January 1 to February 21, 2020, are 27% lower than the corresponding period in 2019.
- JSCC with 52% share and LCH SwapClear with 48% in Q4 2019 – a loss of 2% in JSCC’s share compared with Q3 2019.
- JSCC is down 11% in Q 2019 from a year earlier.
- LCH is up 2% from a year earlier.
The cleared yen swap volumes market share remains fairly evenly split between JSCC and LCH, but with LCH clawing back 2% in the fourth quarter of 2019.
Cleared US dollar credit default swaps
Let’s now switch focus to credit derivatives and the volume of credit indexes and single names in US dollars.
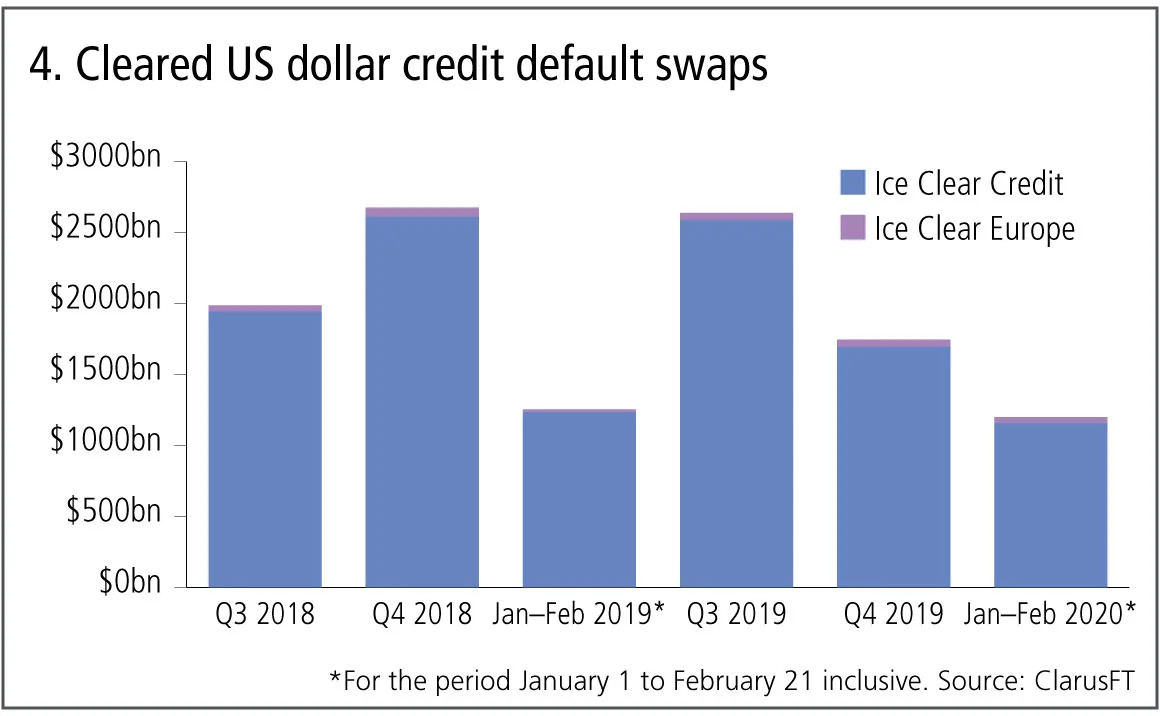
Figure 4 shows:
- Q4 2019 volumes at $1.75 trillion are down 35% from a year earlier and down 34% from Q3 2019.
- Volumes in the period January 1 to February 21, 2020, are 4% lower than the corresponding period in 2019.
- Ice Clear Credit dominates with 97% share.
Cleared euro credit default swaps
Next, the volume of credit indexes and single names in euro.
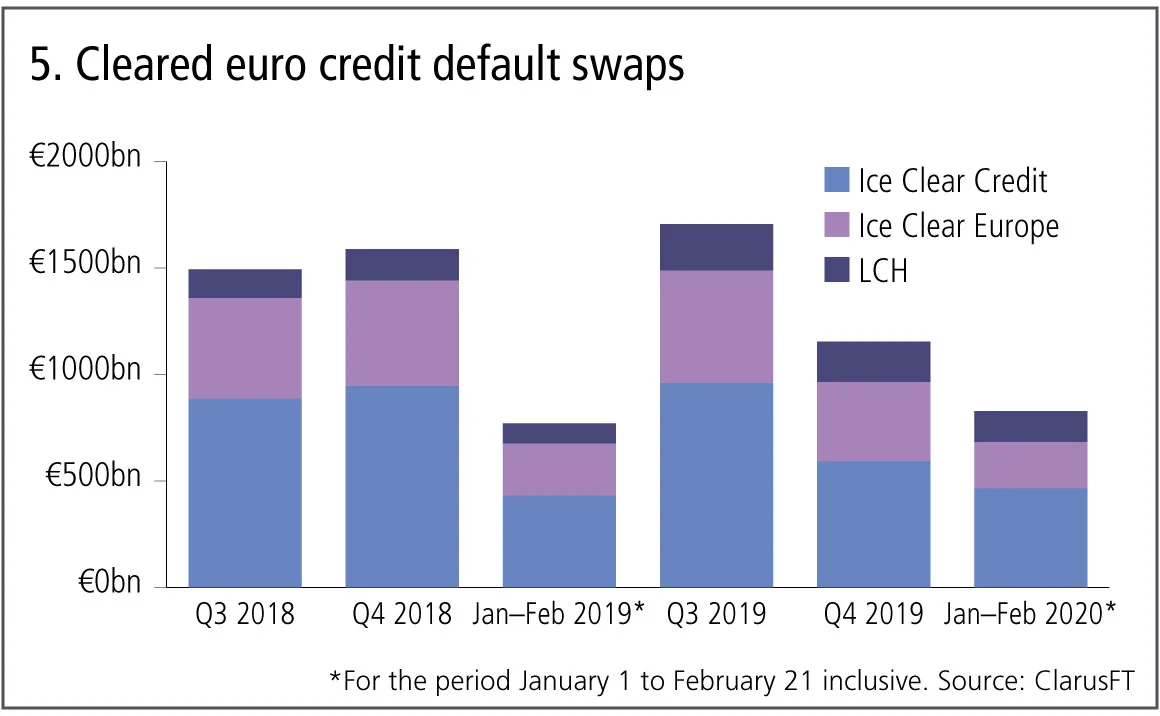
Figure 5 shows:
- Q4 2019 volumes at €1.15 trillion are 27% lower than a year earlier and 32% lower than Q3 2019.
- Volumes in the period January 1 to February 21 are 8% higher than the corresponding period in 2019.
- Ice Clear Credit with 51.3%, Ice Clear Europe 32.3% and LCH CDSClear with 16.5% market share in Q4 2019, which compares with 56.3%, 31.9% and 12.8% in Q3 2019.
- Ice Clear Credit down 37%, Ice Clear Europe down 25% and LCH CDSClear up 28% from a year earlier.
Cleared credit derivatives volumes in euro are lower by a similar amount to US dollars, with Ice Clear Credit the largest. LCH CDS Clear is growing faster from a lower base and is the only CCP to increase volume in the fourth quarter.
Cleared non-deliverable forwards
Finally, cleared non-deliverable forwards and FX options.
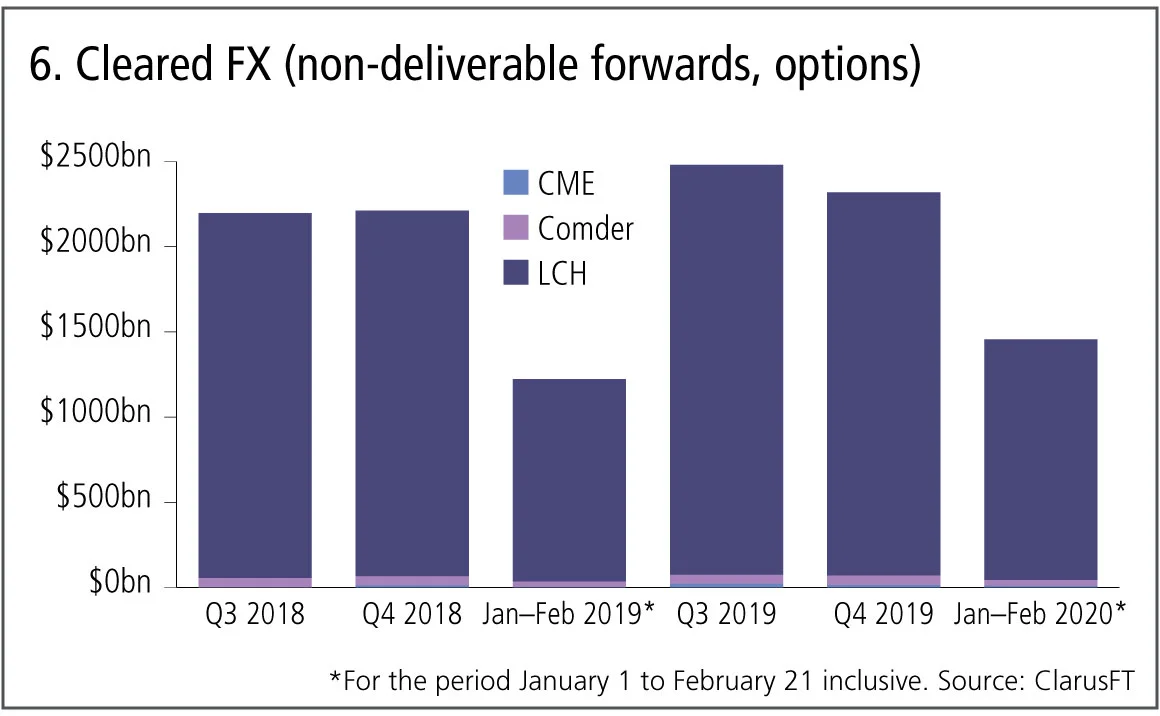
Figure 6 shows:
- Q4 2019 volumes at $2.3 trillion are 5% higher than a year earlier but down 7% from Q3 2019.
- LCH ForexClear, with 97% share in the quarter, unchanged from prior quarters.
- Comder with 2.4% and CME with 0.6%.
Cleared non-deliverable forwards are the only product we have looked at that has higher volumes in the fourth quarter of 2019 compared with a year earlier.
Amir Khwaja is chief executive of Clarus Financial Technology
Only users who have a paid subscription or are part of a corporate subscription are able to print or copy content.
To access these options, along with all other subscription benefits, please contact info@risk.net or view our subscription options here: http://subscriptions.risk.net/subscribe
You are currently unable to print this content. Please contact info@risk.net to find out more.
You are currently unable to copy this content. Please contact info@risk.net to find out more.
Copyright Infopro Digital Limited. All rights reserved.
As outlined in our terms and conditions, https://www.infopro-digital.com/terms-and-conditions/subscriptions/ (point 2.4), printing is limited to a single copy.
If you would like to purchase additional rights please email info@risk.net
Copyright Infopro Digital Limited. All rights reserved.
You may share this content using our article tools. As outlined in our terms and conditions, https://www.infopro-digital.com/terms-and-conditions/subscriptions/ (clause 2.4), an Authorised User may only make one copy of the materials for their own personal use. You must also comply with the restrictions in clause 2.5.
If you would like to purchase additional rights please email info@risk.net
More on Comment
Podcast: Pietro Rossi on credit ratings and volatility models
Stochastic approaches and calibration speed improve established models in credit and equity

Op risk data: Kaiser will helm half-billion-dollar payout for faking illness
Also: Loan collusion clobbers South Korean banks; AML fails at Saxo Bank and Santander. Data by ORX News

Beyond the hype, tokenisation can fix the pipework
Blockchain tech offers slicker and cheaper ops for illiquid assets, explains digital expert

Rethinking model validation for GenAI governance
A US model risk leader outlines how banks can recalibrate existing supervisory standards

Malkiel’s monkeys: a better benchmark for manager skill
A well-known experiment points to an alternative way to assess stock-picker performance, say iM Global Partner’s Luc Dumontier and Joan Serfaty

The state of IMA: great expectations meet reality
Latest trading book rules overhaul internal models approach, but most banks are opting out. Two risk experts explore why

How geopolitical risk turned into a systemic stress test
Conflict over resources is reshaping markets in a way that goes beyond occasional risk premia

Op risk data: FIS pays the price for Worldpay synergy slip-up
Also: Liberty Mutual rings up record age bias case; Nationwide’s fraud failings. Data by ORX News
