
Swaps data: CCPs – a systemically important market infrastructure
Disclosures show heavy concentration of initial margin in the top three clearing services, writes Amir Khwaja

With more than $1 trillion of financial resources backing cleared trades, and billions of dollars of cash flowing daily between members and clients, clearing houses today are systemically important market infrastructures.
The latest set of quantitative disclosures show $740 billion held as initial margin (IM) – the largest weapon used by central counterparties to protect against risk. Almost half of this is held as cash. Default resources account for another $210 billion.
We aggregate data for more than 50 clearing houses or services, ranging from global firms such as CME, Eurex, Ice and LCH to small regional firms such as AthexClear, KDPW and Keler. A clearing house can operate one or more clearing services and while the distinction is clear, to coin a pun, some disclosures are provided for a clearing house, while others are for a clearing service. So the 50 figure is an understatement if we refer to clearing services and an overstatement if we discuss clearing houses.
Futures and options together account for the largest IM amount by product type, but LCH SwapClear emerges as the largest single clearing service with $159 billion of IM. Clearing can be a lumpy business – the top three services together account for 43% of IM.
Crucially, estimated stress losses as a peak day amount for the default of two participants stood at $56 billion at the mid-point of the year – significantly lower than the $98 billion of prefunded default resources. Capital provided by clearing house owners, so-called ‘skin in the game’, totalled $16 billion – 7.6% of all default resources.
Initial margin
Let’s start with the largest financial resource, initial margin. We aggregate it for all the clearing services we have and separate into house, meaning member firms, and client, meaning firms that do not mutualise losses by contributing to the default fund (DF).
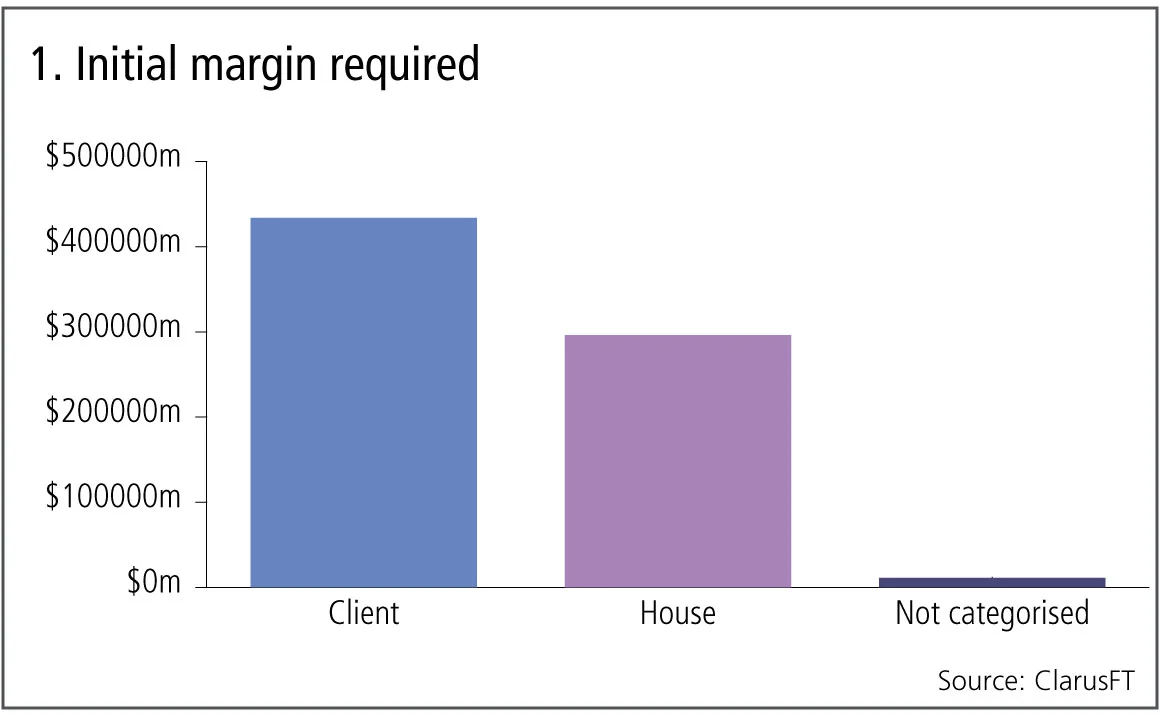
Figure 1 shows:
- Aggregate IM required from client firms is $434 billion, while that required from house (member firms) is $296 billion.
- A split of 59% to 40% with 1% not categorised.
- A grand total of $740 billion as of June 28, 2019.
Next, let’s try to segment this IM by product type. We use product type in a loose sense, so we assign each clearing service to one product type. Often that is obvious from the name of the clearing service but other times we have to plumb for one as there is no split available.
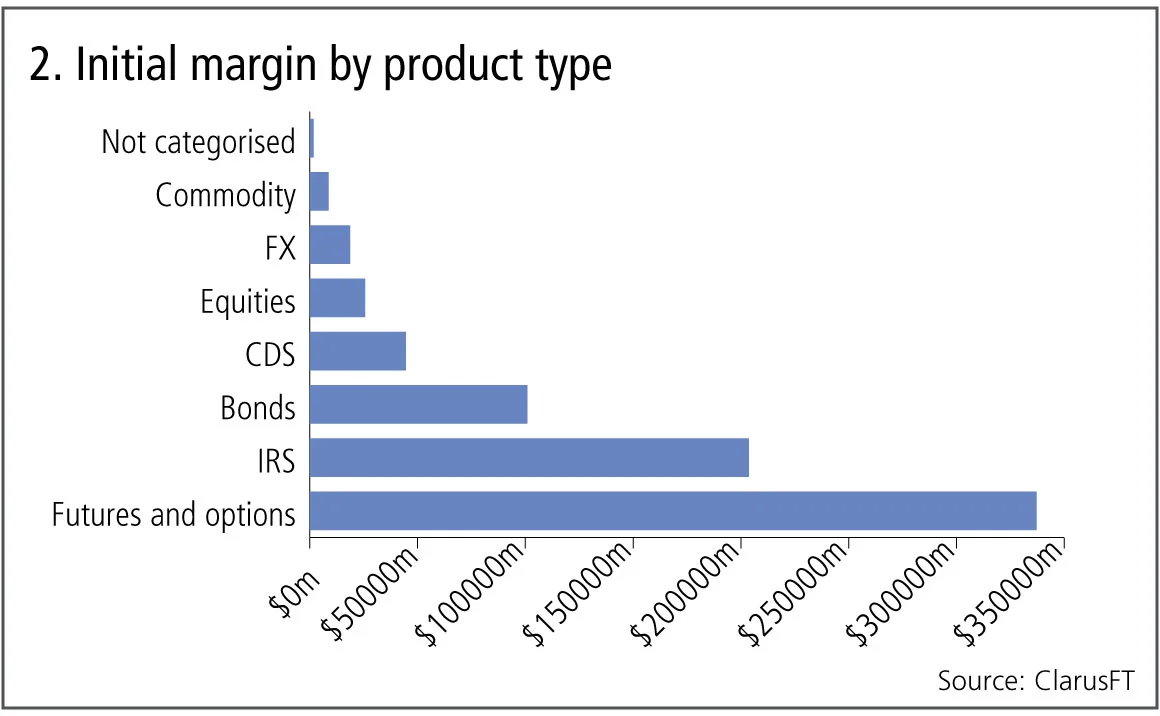
Figure 2 shows:
- Futures and options is by far the largest product type with $337 billion.
- Interest rate swaps with $204 billion.
- Bonds and repos with $101 billion.
- Credit default swaps with $44 billion.
- Equities, meaning cash equities, which as they settle on T+1 or T+2, attract low margins, with $26 billion.
- Foreign exchange and commodity are those clearing services with one of these in the name, and consequently look small as they do not include forex or commodity futures and options that are cleared at the global clearing houses such as CME or Ice.
The three largest clearing services by initial margin required as of June 28, 2019, were LCH SwapClear with $159 billion, CME Base with $97 billion and B3 (Bovespa) with $59 billion. These three represent 43% of the overall initial margin, a chunky share indeed.
Default resources
Next let’s look at the second-largest financial resource, the default fund resources that clearing houses require from members and their owners to mutualise losses. We aggregate all 50 services and show by type of default resource.

Figure 3 shows:
- Member contributions that are prefunded, so the cash or securities have been provided to the clearing service, are by far the largest at $92 billion.
- Next are member contributions that are committed to address the default of one or more members at $62 billion.
- Then member contributions required to replenish a default fund, which has been drawn down in a default, with $37 billion.
- Own capital – capital provided by the owners of the clearing service, which are either private companies or member-owned companies – is $11 billion to address a default and $3 billion and $2 billion pre-funded before and after member contributions.
- Total default resources come to $210 billion.
It would be easy to calculate ratios and say that own capital is a low percentage of aggregate resources and should be much higher, even a fixed percentage as proposed recently by a group of financial firms and commonly referred to as ‘skin in the game’. However I think that is a massive over-simplification of a complex topic and best left to an article where time and space permits a consideration of the arguments. One point to highlight is that prefunded resources total $99 billion or 47% of total resources, a healthy percentage and highlights the readily available funds to address defaults.
Cash for initial margin and default funds
In fact if we look at the disclosures of how much cash (not securities) is held by clearing houses for initial margin and default resources, we see the following:
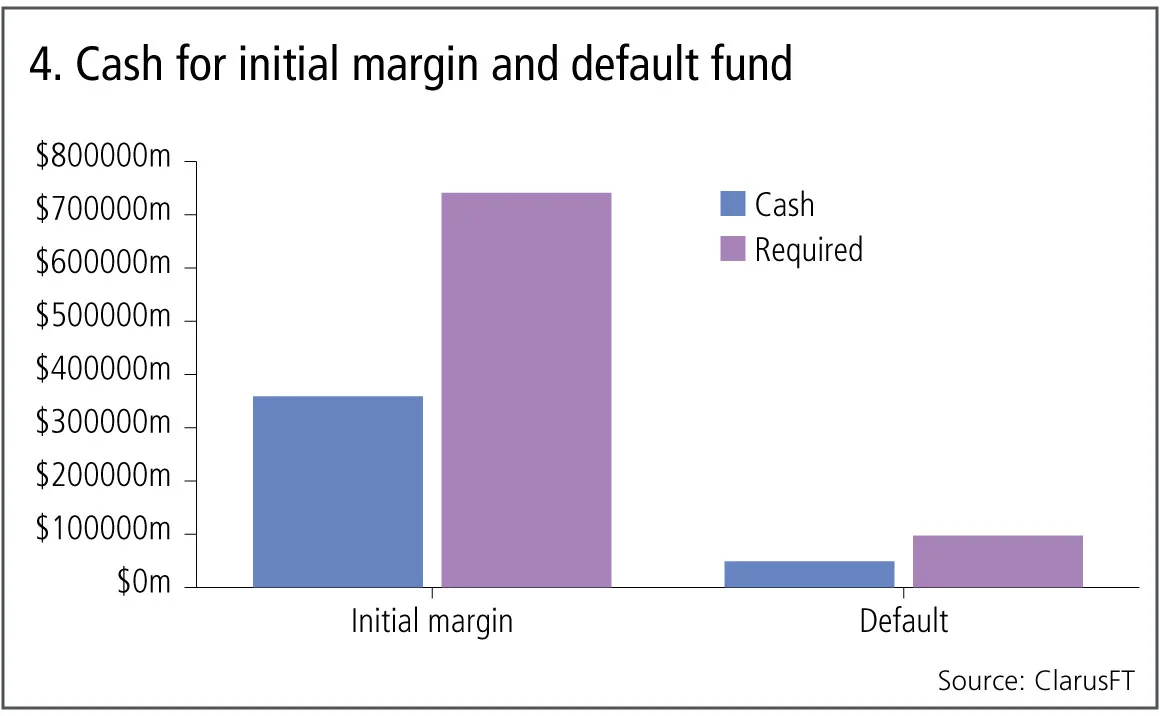
Figure 4 shows:
- $360 billion of the IM required of $740 billion is cash.
- $49 billion of the prefunded DF of $97 billion is cash.
A lot of liquid cash resources to utilise in the event of market stress and defaults, while a quick look at the largest holders shows that LCH SwapClear held $68 billion cash for IM required, while CC&G held $10 billion cash for DF contributions.
Stress loss
Given that we have highlighted the size of financial resources held by clearing houses, it is appropriate next to consider disclosures on credit risk and stress losses in extreme but plausible market conditions.
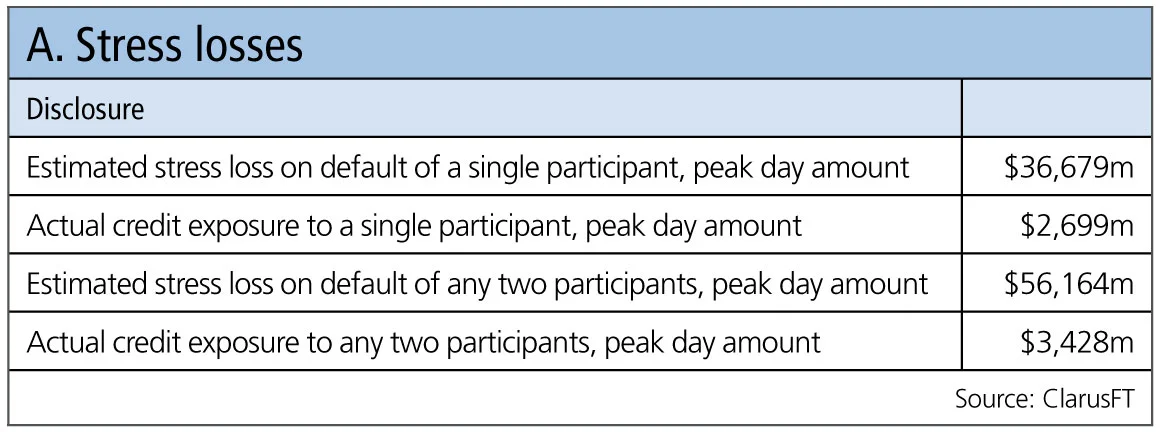
Table A shows:
- Estimated stress losses, as a peak day amount for the default of a single participant or any two participants of $37 billion and $56 billion, each of these are figures in excess of the initial margin of the participant.
Importantly the $56 billion figure is much lower than the prefunded default resources of $98 billion, let alone the total default resources of $210 billion.
Margin calls
And last but not least, let’s take a peek at the aggregate size of margin calls.
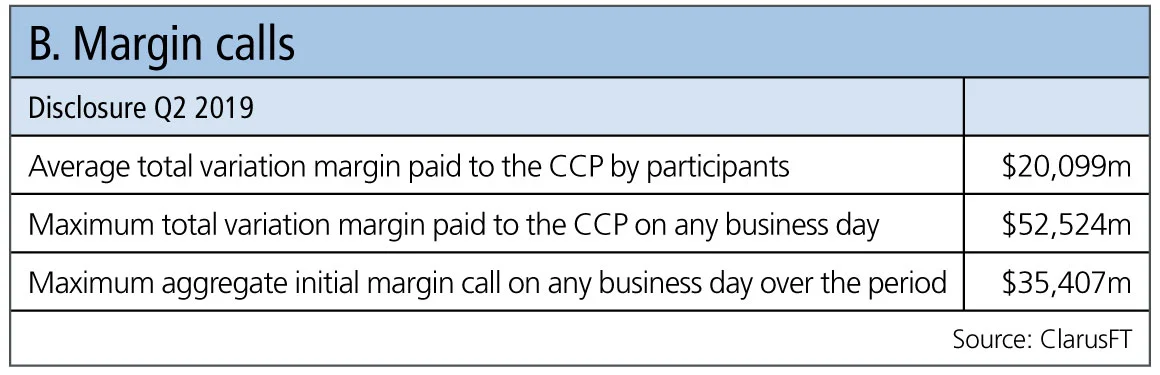
Table B shows:
- Average total variation margin (VM) paid in the quarter ending June 28, 2019, was $20 billion.
- The maximum VM – this being an aggregate from each clearing service and which will have occurred on different days – was $52 billion.
- The maximum aggregate initial margin call, again on different days no doubt, was $35 billion, and we know some services include intra-day VM calls within this disclosure.
That’s it for now, $740 billion of initial margin, $210 billion of default resources, average daily variation margin calls of $20 billion, oodles of cash; clearing houses really are a $1 trillion systemically important market infrastructure.
Amir Khwaja is chief executive of Clarus Financial Technology.
Only users who have a paid subscription or are part of a corporate subscription are able to print or copy content.
To access these options, along with all other subscription benefits, please contact info@risk.net or view our subscription options here: http://subscriptions.risk.net/subscribe
You are currently unable to print this content. Please contact info@risk.net to find out more.
You are currently unable to copy this content. Please contact info@risk.net to find out more.
Copyright Infopro Digital Limited. All rights reserved.
As outlined in our terms and conditions, https://www.infopro-digital.com/terms-and-conditions/subscriptions/ (point 2.4), printing is limited to a single copy.
If you would like to purchase additional rights please email info@risk.net
Copyright Infopro Digital Limited. All rights reserved.
You may share this content using our article tools. As outlined in our terms and conditions, https://www.infopro-digital.com/terms-and-conditions/subscriptions/ (clause 2.4), an Authorised User may only make one copy of the materials for their own personal use. You must also comply with the restrictions in clause 2.5.
If you would like to purchase additional rights please email info@risk.net
More on Comment
Why do prices jump?
After years of investigation, we still aren’t sure, says Jean-Philippe Bouchaud

Don’t mind the gap risk: regulatory treatment of credit repacks
Gap risk in repackaging is not a credit valuation adjustment for Basel III capital purposes, argues senior quant Andrey Chirikhin

Op risk data: HSBC hit with $400m external fraud loss
Also: China’s unlicensed trading clampdown; SocGen’s insurance mis-selling woes. Data by ORX News

Vinicius fortune: quantifying luck in the World Cup draw
Julien Guyon explains how bias, variance and luck affect teams in this summer’s tournament – and explores wider relevance for portfolio managers

G-Sib capital surcharge: how indexing and averaging alter incentives
Capital risk strategist anticipates Basel III endgame impact on US big-bank behaviour

Podcast: Abi-Jaber and Li on a ‘sticky’ volatility problem
The pair discuss their model to jointly capture Vix, SPX and SSR

Markets perceive the future in very distorted ways
Discounting paradigms should adapt to be more realistic, says Jean-Philippe Bouchaud

Op risk data: Cyber hacks shake crypto protocols
Also: JP Morgan fined over investor losses; Symetra’s Methodist pensions mess. Data by ORX News
