
Swaps data: analysing the US rates collapse
Prices collapse and expected worst-loss numbers hit new records
As we return from holidays after an August month with some extraordinary events – such as 30-year US Treasury yields falling below 2% for the first time in history, $17 trillion of bonds carrying a negative yield and the inversion of the yield curve – it is interesting to hone in on what has been happening in the swaps market.
Specifically early August saw massive falls in swap rates, the like of which we have not witnessed since the 2008 financial crisis. These resulted not only in much higher swap volumes in the first week of August 5–9, but also in some of the largest worst five-day loss numbers since that crisis, according to initial margin models.
The moves also led to a collapse of the CME-LCH swap basis to virtually zero and an increase in central counterparty (CCP) switch activity.
US dollar swap rates
Let’s start by looking at a time series of US dollar swap prices, with each day’s price determined by a volume-weighted average pricing methodology from transactions reported to trade repositories, giving us a robust comparison of actual prices.
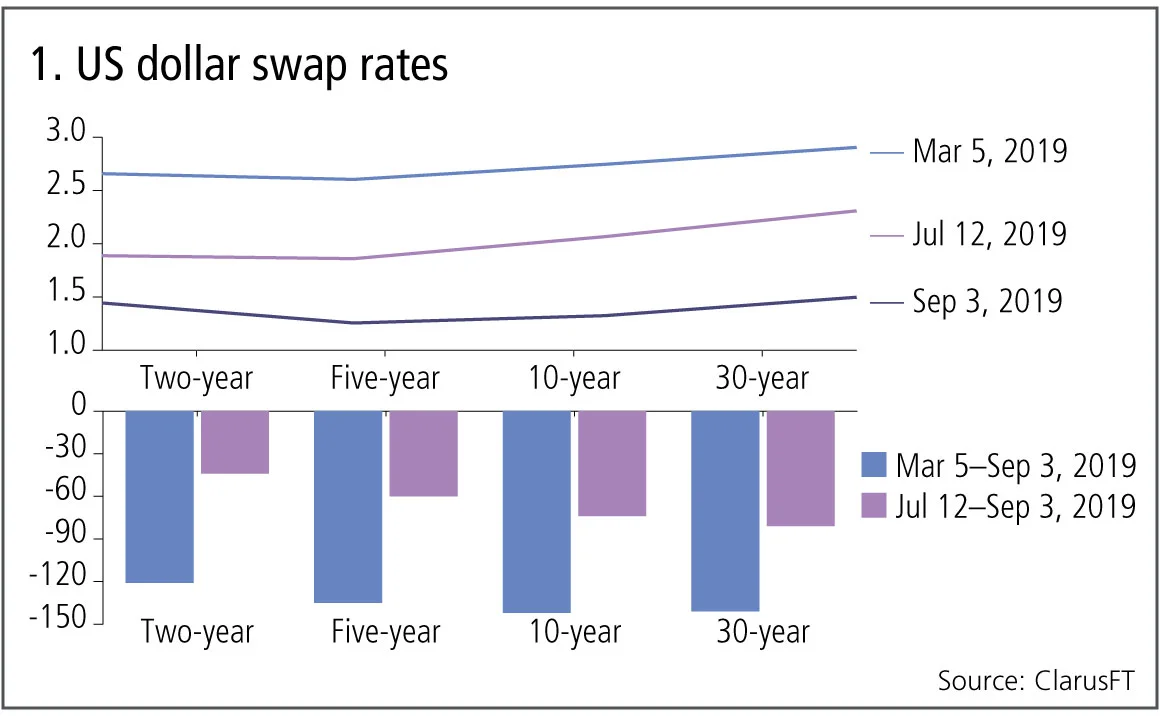
Figure 1 shows:
- How the major tenors of two-year, five-year, 10-year and 30-year have changed on three dates, March 5, July 12 and September 3.
- The 30-year dropping 140 basis points from 2.9% on March 5 to 1.5% on September 3 and 80bp between July 12 and September 3.
- Massive moves indeed with similar falls in all tenors, just less pronounced in short tenors, leading to an inversion of the swap curve, with two-year at 1.45% and 10-year at 1.33%.
Another way to look at these moves is to calculate summary statistics on the one-day returns, which are shown below for 10-year swap rates.
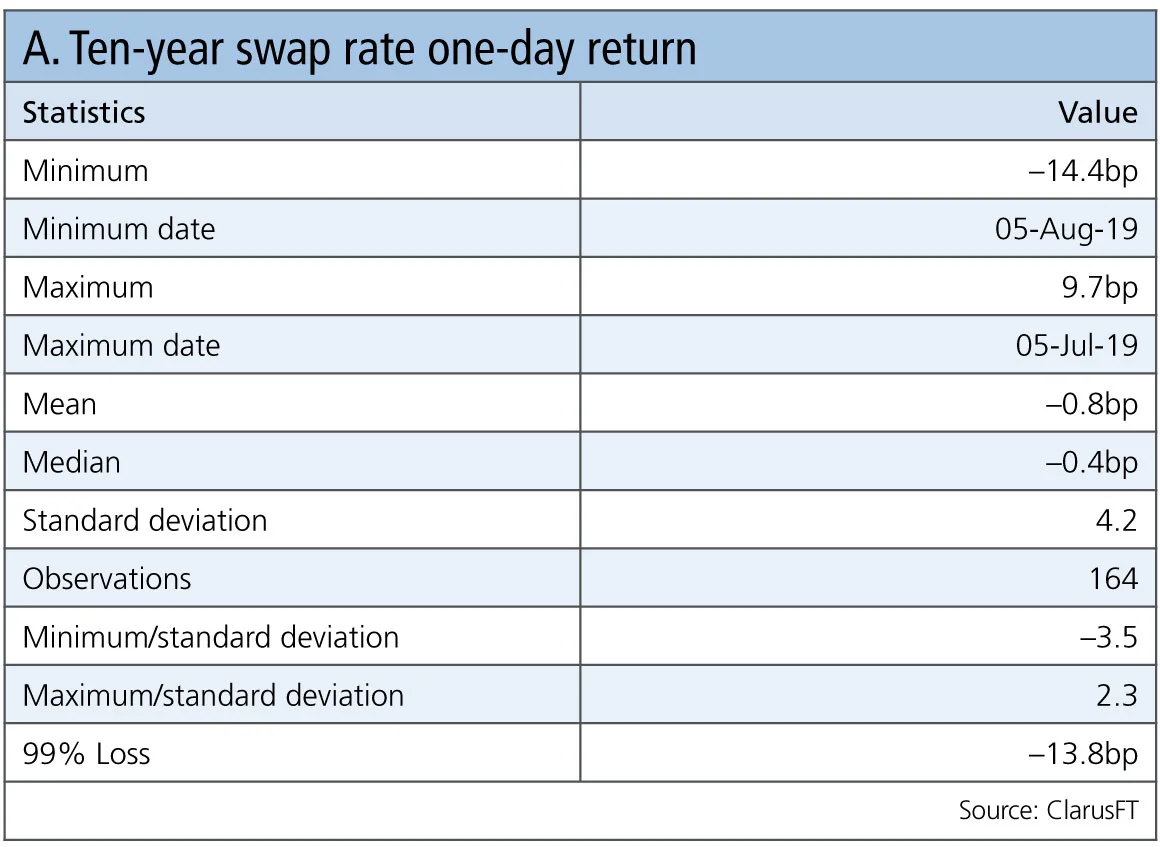
Table A shows:
- The largest one-day drop was –14.4bp on August 5 and the largest rise 9.7bp on July 5.
- From out of 164 observations between January 2 and September 4, we can calculate the standard deviation as 4.2bp, making the largest drop a 3.5 standard deviation move; significant indeed.
- And our 99% confidence level loss move is –13.8% basis
Historical perspective
A way to get a sense of how significant the market moves we have seen in the past few months are is to take a much longer-term perspective and go back in history all the way to the Lehman bankruptcy in 2008.
An interesting way to do this is to use cleared swap initial margin models, as these incorporate historical simulations with long lookback periods that include the massive market moves we saw in the financial crisis of 2008.
Let’s do this for the CME initial margin model for a US dollar 10-year pay-fixed swap and drill down to the worst loss tail scenarios, which in this case are five-day moves.
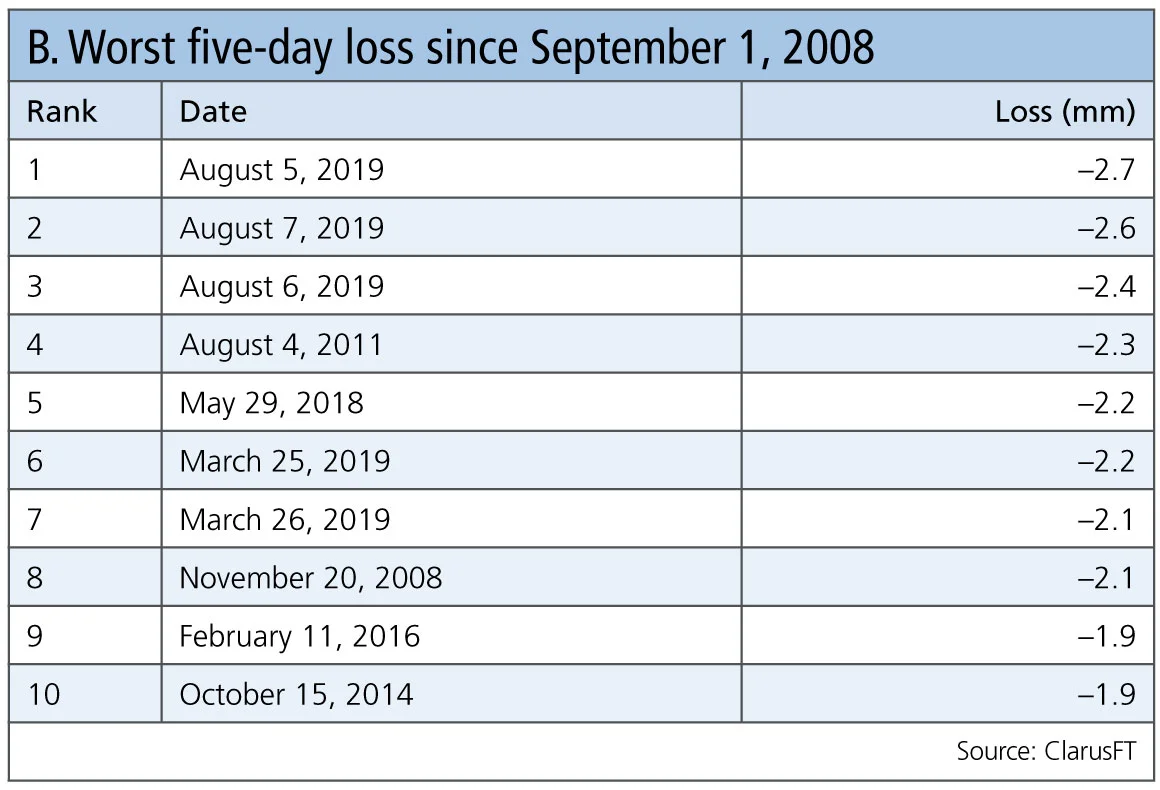
Table B shows:
- The three worst loss five-day periods are all in August 2019.
- The 10 worst loss dates include five dates in 2019 – three in August and two in March. That really puts into perspective just how significant these drops are, even allowing for the fact that, as time passes, the historical simulation methodology will give less significance to recent moves due to time decay and volatility scaling.
- The magnitude of these moves in the swap rate is –40bp (not shown).
- If the initial margin was determined by worst loss, which it is not for CME, then the worst loss is $2.7 million. Without any 2019 scenarios, it would have been $2.3 million, an increase of 17%.
- Expected shortfall or a value-at-risk measure at 99.7% confidence level would also give a similar magnitude of a 17% increase.
Now that we have categorically established that the market moves in US dollar swap rates we have seen in August are historically significant, let’s look at a few of the less obvious consequences of these moves.
CME-LCH CCP basis spreads
The price of a US dollar swap cleared at CME or LCH has been significantly different for four years, even though the product is economically the same. The reason for the basis spread, which has been as wide as 3.75bp in 2019 for 30-year, is the asymmetry between payers and receivers at CME, requiring dealers to hedge at LCH and pay two lots of gross margin, the cost of which they need to recover in the price charge to the client for the trade at CME.
Let’s see what has happened to this basis.
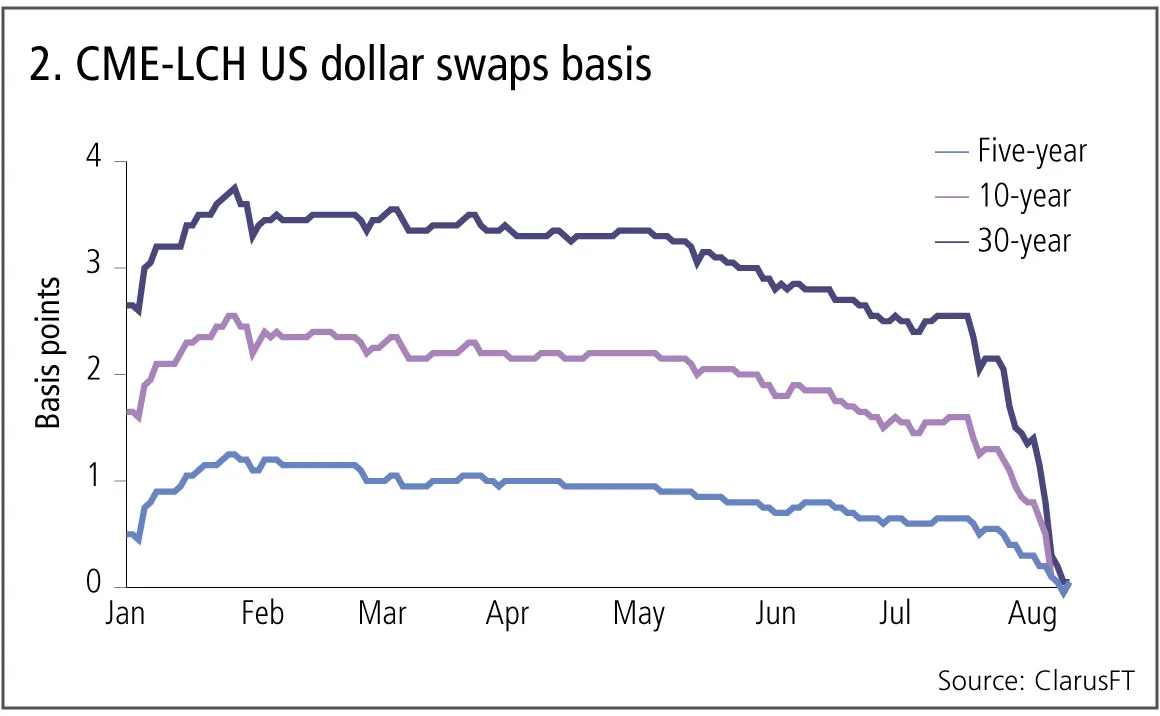
Figure 2 shows:
- The 30-year basis spread hit a high of 3.75bp on January 25 and dropped sharply mid-July, end-July and early August to end at 0.05bp.
- The 10-year started the year at 1.65bp, followed a similar pattern to the 30-year, went briefly negative on August 7 and is now also 0.05bp.
In general, we can say the massive moves down in rates and the expectation of further rate cuts has altered the balance of payers and receivers at CME to the point that it is balanced enough to drive down the basis to virtually zero.
CME-LCH CCP switch volume
We can also look specifically at the volume of CCP switch trades that dealer-to-dealer swap execution facilities report.
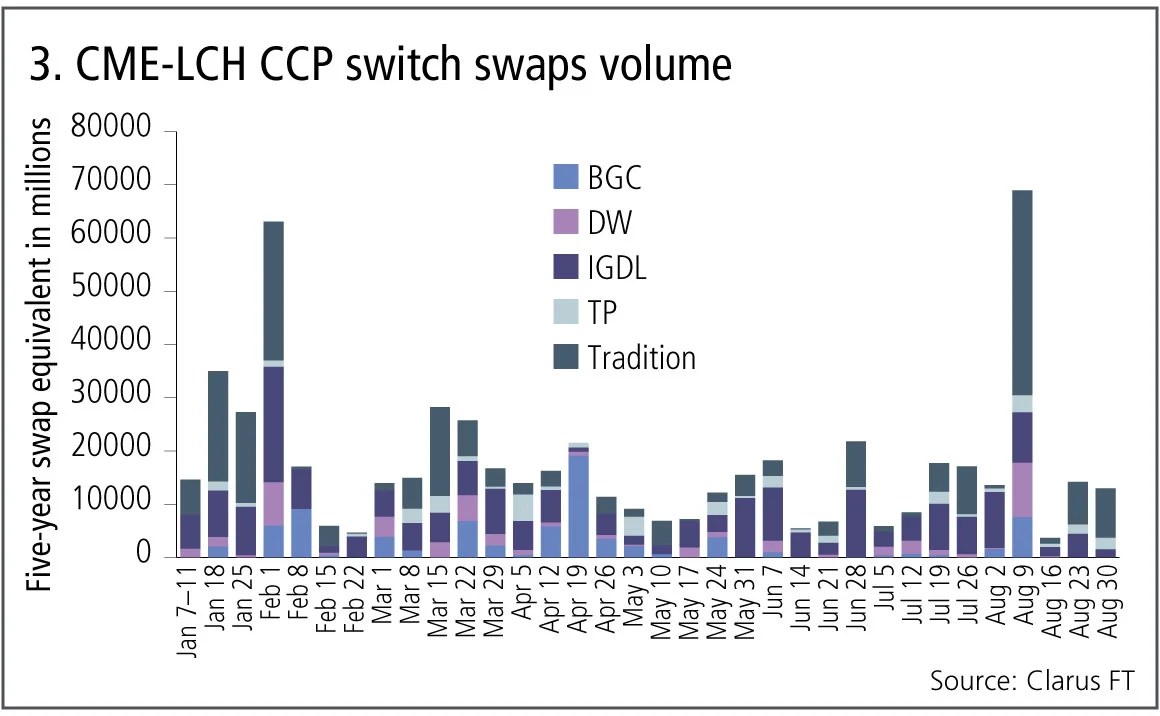
Figure 3 shows:
- Weekly volumes in five-year swap equivalent notional for 2019 year-to-date.
- The week starting August 5 and ending August 9, the same week as our largest five-day price moves, shows the highest peak with $69 billion transacted.
- The majority of this is at Tradition, followed by Dealerweb, Icap-IGDL and BGC.
- The only comparable week in volume was the week ending February 1.
So not only has the CME-LCH basis collapsed, but at least in one specific week there was greatly increased switching of CCP risk exposure.
Swap volumes on interdealer platforms
Before we end, let’s take a look at the overall volume by week of US dollar swaps on dealer-to-dealer swap execution facilities (Sefs).
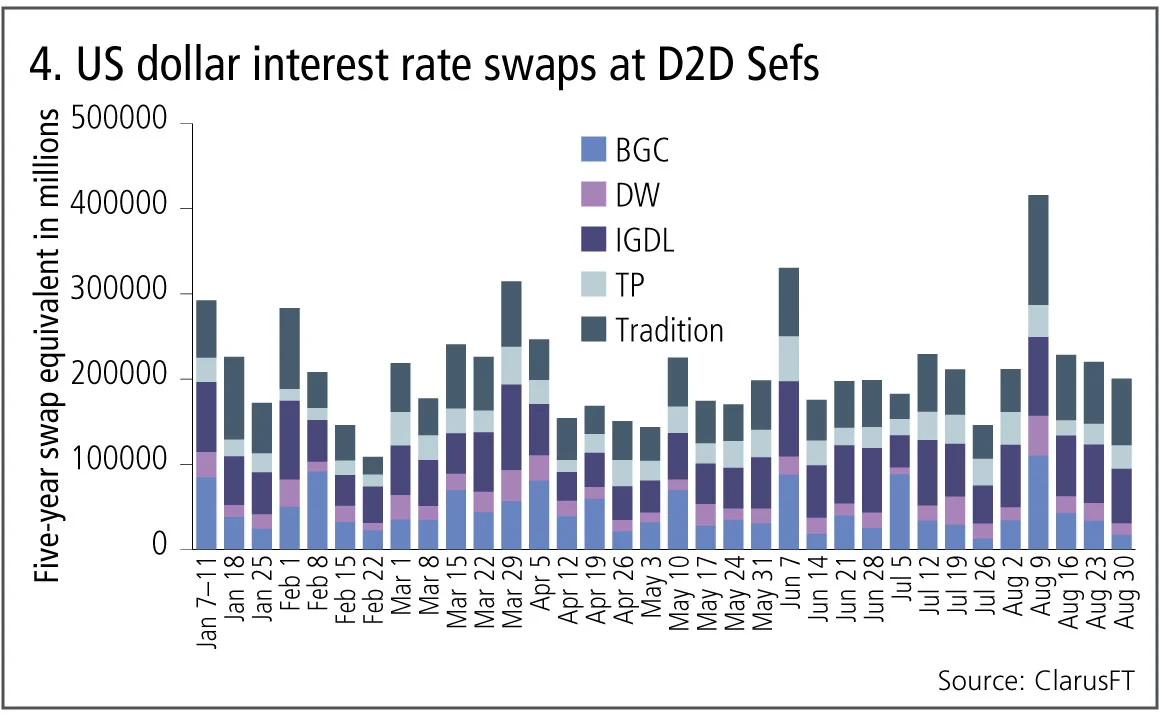
Figure 4 shows:
- The week ending August 9 again the highest with $416 billion of five-year equivalent swap notional, far higher than the next highest of $330 billion.
The large change in prices, driving massive volume in this week, is most unusual for the time of year. It will be interesting to see if September lives up to August, given it is the more consequential month in setting trends for the year ahead.
Amir Khwaja is chief executive of Clarus Financial Technology.
Only users who have a paid subscription or are part of a corporate subscription are able to print or copy content.
To access these options, along with all other subscription benefits, please contact info@risk.net or view our subscription options here: http://subscriptions.risk.net/subscribe
You are currently unable to print this content. Please contact info@risk.net to find out more.
You are currently unable to copy this content. Please contact info@risk.net to find out more.
Copyright Infopro Digital Limited. All rights reserved.
As outlined in our terms and conditions, https://www.infopro-digital.com/terms-and-conditions/subscriptions/ (point 2.4), printing is limited to a single copy.
If you would like to purchase additional rights please email info@risk.net
Copyright Infopro Digital Limited. All rights reserved.
You may share this content using our article tools. As outlined in our terms and conditions, https://www.infopro-digital.com/terms-and-conditions/subscriptions/ (clause 2.4), an Authorised User may only make one copy of the materials for their own personal use. You must also comply with the restrictions in clause 2.5.
If you would like to purchase additional rights please email info@risk.net
More on Comment
Markets never forget: the lasting impression of square-root impact
Jean-Philippe Bouchaud argues trade flows have a large and long-term effect on asset prices
Podcast: Pietro Rossi on credit ratings and volatility models
Stochastic approaches and calibration speed improve established models in credit and equity
Op risk data: Kaiser will helm half-billion-dollar payout for faking illness
Also: Loan collusion clobbers South Korean banks; AML fails at Saxo Bank and Santander. Data by ORX News
Beyond the hype, tokenisation can fix the pipework
Blockchain tech offers slicker and cheaper ops for illiquid assets, explains digital expert
Rethinking model validation for GenAI governance
A US model risk leader outlines how banks can recalibrate existing supervisory standards
Malkiel’s monkeys: a better benchmark for manager skill
A well-known experiment points to an alternative way to assess stock-picker performance, say iM Global Partner’s Luc Dumontier and Joan Serfaty
The state of IMA: great expectations meet reality
Latest trading book rules overhaul internal models approach, but most banks are opting out. Two risk experts explore why
How geopolitical risk turned into a systemic stress test
Conflict over resources is reshaping markets in a way that goes beyond occasional risk premia


