
Swaps data: volumes up amid volatility
Data shows strong growth in cleared OTC derivative volumes in second half of 2018, says Amir Khwaja

As 2018 comes to an end, with Brexit dominating the news, trade tensions escalating and the Federal Reserve maintaining its rate-hike path, it is a good time to take stock of global swap volumes.
Instead of hiding from the uncertainty, swap users appear to have instead dived right in. Volumes are up across the board, with third-quarter numbers increasing in 2018 compared with the same period in 2017, and the October-November period following suit.
US dollar credit default swaps and euro interest rate swaps in particular have had a strong end to the year. The latter saw a 176% increase in volumes at Eurex and 63% at LCH in October-November 2018 versus 2017.
The only exception has been yen interest rate swaps, where volumes were down in the third quarter in 2018 versus 2017, but up in October-November 2018 versus the previous year.
Cleared US dollar swaps
Let’s start with the largest product: cleared US dollar interest rate swaps. We include all clearable types – vanilla fixed vs float, overnight index, basis, zero coupon and variable notional.
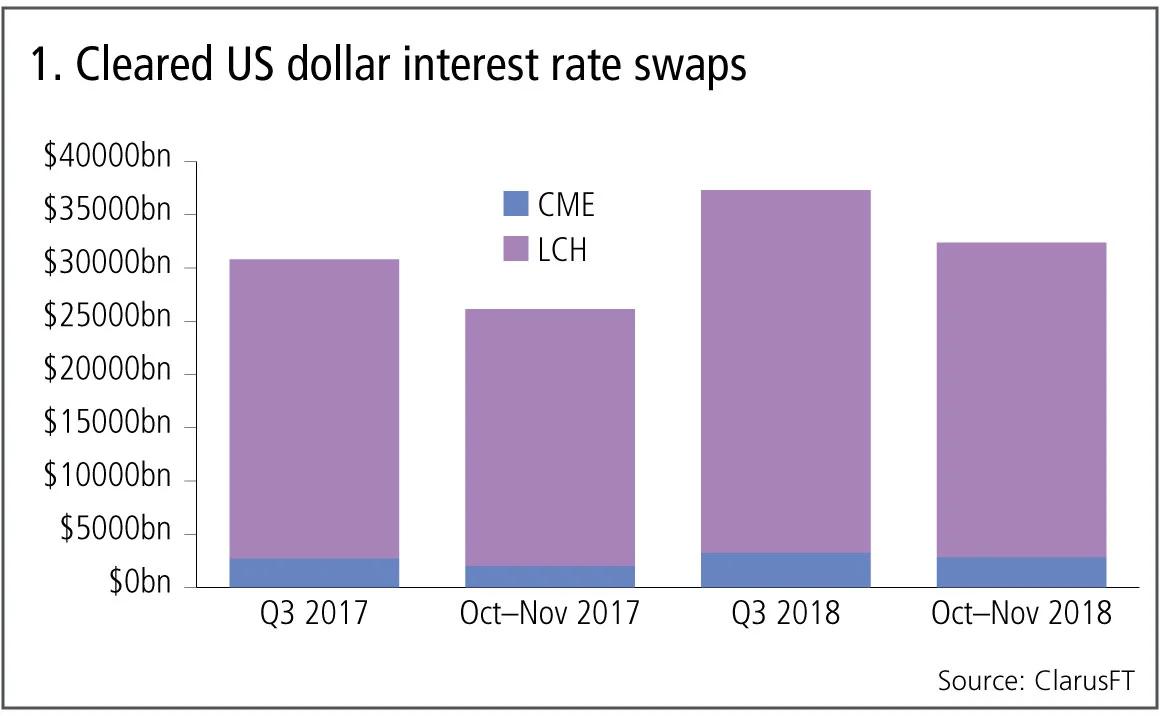
Figure 1 shows:
- Volumes are significantly higher in 2018.
- Overall volumes of $37 trillion in Q3 18 and $32 trillion in Oct–Nov 2018.
- LCH SwapClear with 91% share and CME with 9%.
- LCH SwapClear up 22% in each of these periods.
- CME over-the-counter up 20% in Q3 18 and up 40% in Oct–Nov 2018.
Both clearing houses saw significant growth in volumes in 2018 over the corresponding periods in 2017 and the US dollar swap market is in healthy shape.
Cleared euro swaps
Next, the second-largest product: cleared euro interest rate swaps, including all clearable types.
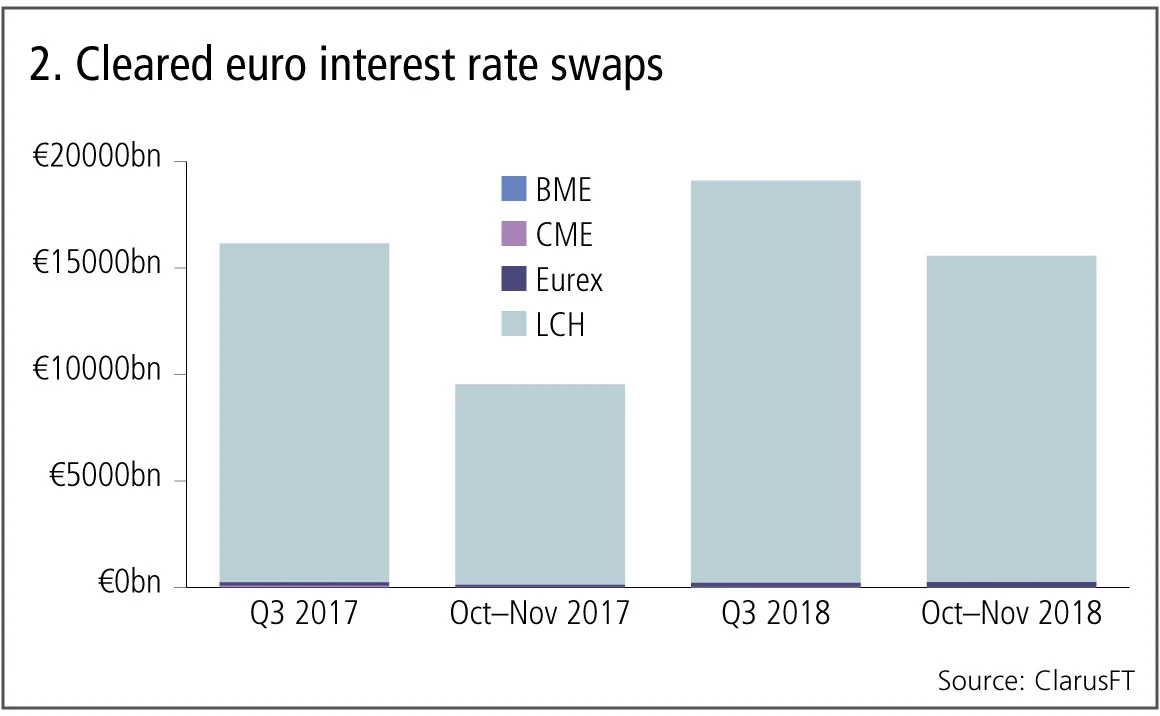
Figure 2 shows:
- Volumes also significantly higher in 2018.
- €19 trillion in Q3 18 and $15.6 trillion in Oct–Nov 2018.
- LCH SwapClear with 98.4% share in the most recent period.
- LCH SwapClear up 19% in Q3 18 and a massive 63% in Oct–Nov 2018, driven by 110% growth in OIS volumes and 39% in IRS.
- Eurex with 1.6% share in the Oct–Nov 2018.
- Eurex up 22% in Q3 18 and a massive 173% in Oct–Nov 2018.
- CME OTC down 75%.
- BME with no volume in the recent past.
LCH SwapClear continuing its dominance in euro swap volumes, with signs of Eurex growing fast from a much smaller base.
Cleared yen swaps
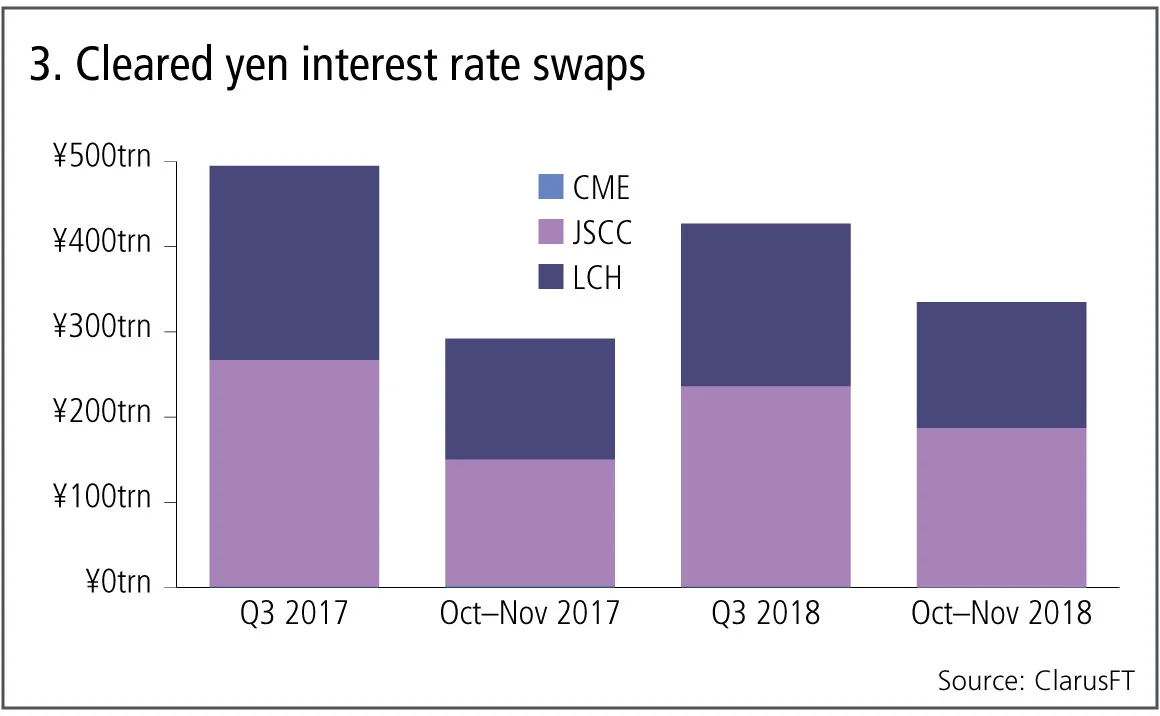
Figure 3 shows:
- Volumes for yen were down in Q3 18 but up for Oct–Nov 2018.
- 427 trillion yen in Q3 18 and 336 trillion yen in Oct–Nov 2018.
- JSCC with 56% share and LCH SwapClear with 44%.
- JSCC down 12% in Q3 18 and up 27% in Oct–Nov 2018.
- LCH down 16% in Q3 18 and up 4% in Oct–Nov 2018.
After three consecutive down quarters in 2018, finally the fourth quarter looks to be breaking the trend and showing growth and JSCC maintaining its lead over LCH.
Cleared US dollar credit default swaps
Let’s now switch focus to credit derivatives and the volume of credit indexes and single names in US dollars.
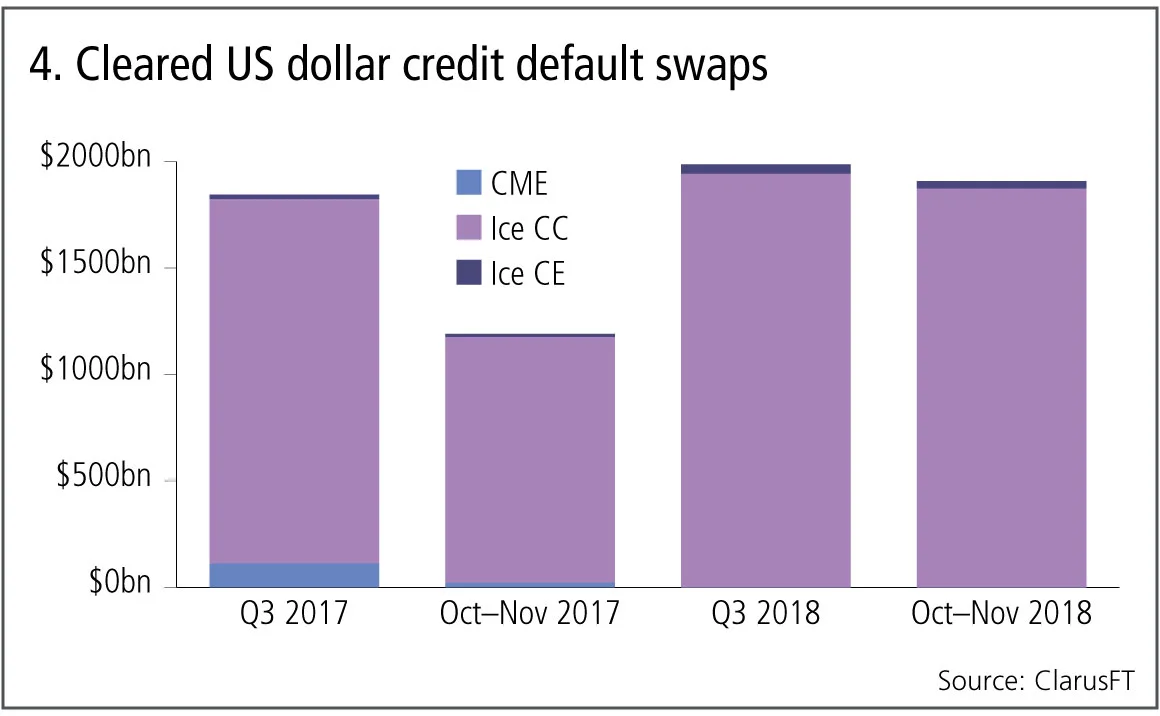
Figure 4 shows:
- Volumes significantly higher in 2018.
- $2 trillion in Q3 18 and $1.9 trillion in Oct–Nov 2018.
- Ice Clear Credit dominates with a 98% share.
- Ice Clear Credit up 14% in Q3 18 and 62% in Oct–Nov 2018.
- Ice Clear Europe also up due to new CDX volume.
- CME shutting down its service.
- LCH CDS with less than $1 billion in each period.
Cleared credit derivatives volumes in US dollars is showing good growth rates, specifically in indexes as opposed to single names.
Cleared euro credit default swaps
Next the volume of credit indexes and single names in euros.
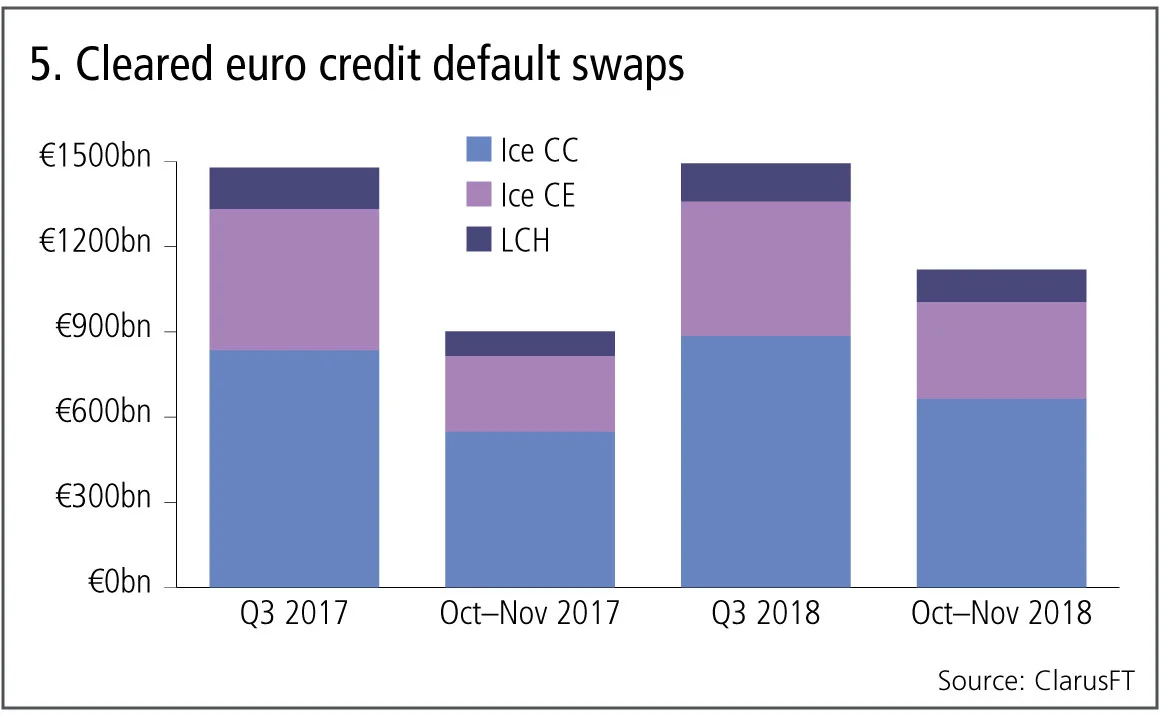
Figure 5 shows:
- Volumes higher in 2018.
- €1.5 trillion in Q3 18 and €1.1 trillion in Oct–Nov 2018.
- Ice Clear Credit with 59% share, Ice Clear Europe 31% and LCH CDSClear with 10%, similar to earlier quarters in 2018.
- Ice Clear Credit up 21% in Oct–Nov 2018.
- Ice Clear Europe up 28% in Oct–Nov 2018.
- LCH CDSClear up 32% in Oct–Nov 2018.
Cleared credit derivatives volumes in euros are also showing good growth rates.
Cleared non-deliverable forwards
Finally cleared non-deliverable forwards.
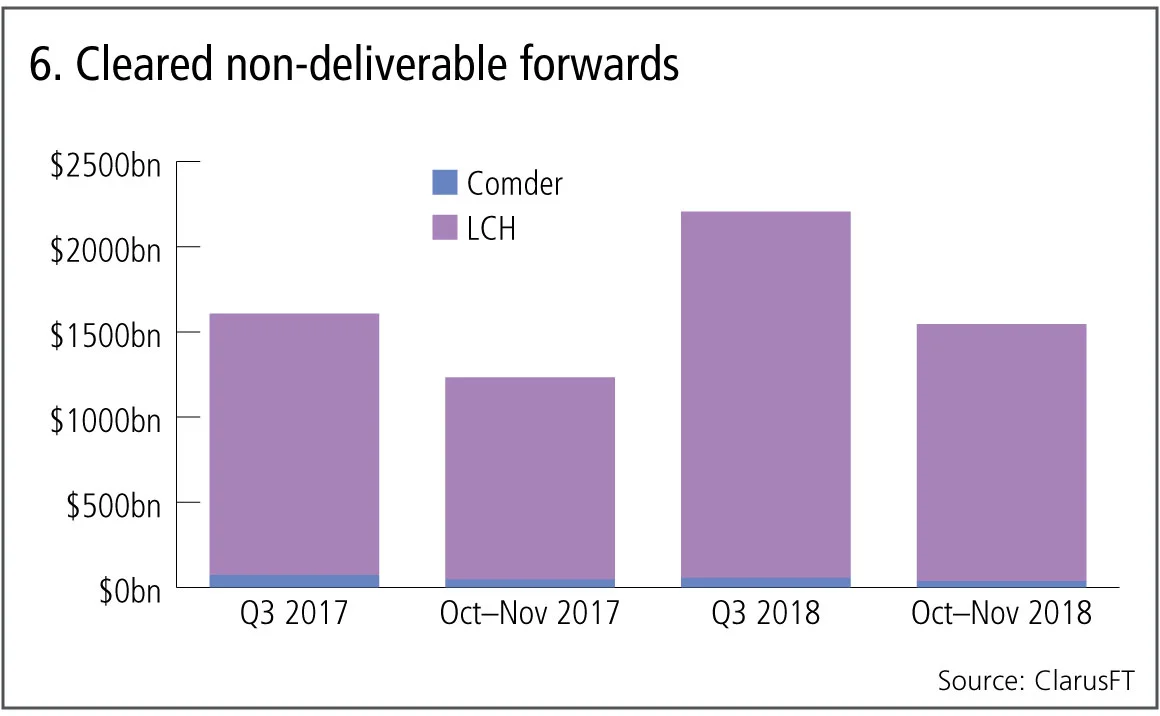
Figure 6 shows:
- Volumes massively higher in 2018.
- $2.2 trillion in Q3 18 and $1.5 trillion in Oct–Nov 2018.
- LCH ForexClear dominant with 98% share.
- LCH ForexClear up 40% in Q3 18 and 27% in Oct–Nov 2018.
- Comder down 18% in Oct–Nov 2018.
Cleared non-deliverable forwards volumes continue a long running trend of high growth rates.
All the other major cleared OTC derivatives markets that we have looked at have higher volumes in the most recent two months than the corresponding period in 2017, in most cases significantly higher.
2018 has been a year of increased price volatility and this is certainly one factor in the higher volumes that we have seen.
It will be interesting to see if next year maintains the growth trend, it certainly appears that political uncertainty and price volatility show no signs of ebbing away.
Amir Khwaja is chief executive of Clarus Financial Technology.
Editing by Lukas Becker
Only users who have a paid subscription or are part of a corporate subscription are able to print or copy content.
To access these options, along with all other subscription benefits, please contact info@risk.net or view our subscription options here: http://subscriptions.risk.net/subscribe
You are currently unable to print this content. Please contact info@risk.net to find out more.
You are currently unable to copy this content. Please contact info@risk.net to find out more.
Copyright Infopro Digital Limited. All rights reserved.
As outlined in our terms and conditions, https://www.infopro-digital.com/terms-and-conditions/subscriptions/ (point 2.4), printing is limited to a single copy.
If you would like to purchase additional rights please email info@risk.net
Copyright Infopro Digital Limited. All rights reserved.
You may share this content using our article tools. As outlined in our terms and conditions, https://www.infopro-digital.com/terms-and-conditions/subscriptions/ (clause 2.4), an Authorised User may only make one copy of the materials for their own personal use. You must also comply with the restrictions in clause 2.5.
If you would like to purchase additional rights please email info@risk.net
More on Comment
Don’t mind the gap risk: regulatory treatment of credit repacks
Gap risk in repackaging is not a credit valuation adjustment for Basel III capital purposes, argues senior quant Andrey Chirikhin

Op risk data: HSBC hit with $400m external fraud loss
Also: China’s unlicensed trading clampdown; SocGen’s insurance mis-selling woes. Data by ORX News

Vinicius fortune: quantifying luck in the World Cup draw
Julien Guyon explains how bias, variance and luck affect teams in this summer’s tournament – and explores wider relevance for portfolio managers

G-Sib capital surcharge: how indexing and averaging alter incentives
Capital risk strategist anticipates Basel III endgame impact on US big-bank behaviour

Podcast: Abi-Jaber and Li on a ‘sticky’ volatility problem
The pair discuss their model to jointly capture Vix, SPX and SSR

Markets perceive the future in very distorted ways
Discounting paradigms should adapt to be more realistic, says Jean-Philippe Bouchaud

Op risk data: Cyber hacks shake crypto protocols
Also: JP Morgan fined over investor losses; Symetra’s Methodist pensions mess. Data by ORX News

Prediction markets can be a canary in the coal mine
Prices of contracts on the likes of Polymarket can act as signals for risk management and hedging, says risk expert
