
Swaps data: a Mifid-shaped hole
Data shows strong growth in US dollar rate swaps, but global picture is incomplete, says Amir Khwaja of Clarus FT

As the first quarter of 2018 ends with the US Federal Reserve still on a rate-hiking path, it’s a good time to take stock of global US dollar swaps volumes.
Unfortunately, that’s easier said than done: while clearing houses, swap execution facilities and swap data repositories (SDRs) all provide parts of the picture, there is a big, Europe-shaped hole in the data. That hole exists despite the efforts of European legislators to bring additional transparency to the over-the-counter derivatives market in the form of the second Markets in Financial Instruments Directive (Mifid II).
Almost three months after its implementation, useful data is still lacking. There are three main reasons. First, the many trading venues and approved publication arrangements have not made it straightforward to collect and aggregate data. Second, the decision by the European Securities and Markets Authority to require international securities identification numbers (Isins) to be used for OTC derivatives – and, worse, for a specific maturity date to be included in the definition – has led to the issuance of 5 million new Isins, and counting. This greatly complicates meaningful aggregation of monthly volume. Third, deferral rules that differ by venue from two days to four weeks, and teething issues in the specifics of the data, make it impossible to aggregate volume on a specific day in a timely manner.
Our hope is still that these issues will be resolved, but it may take months to do so.
Global cleared volumes
Let’s start by comparing monthly volumes in this quarter with a year earlier.
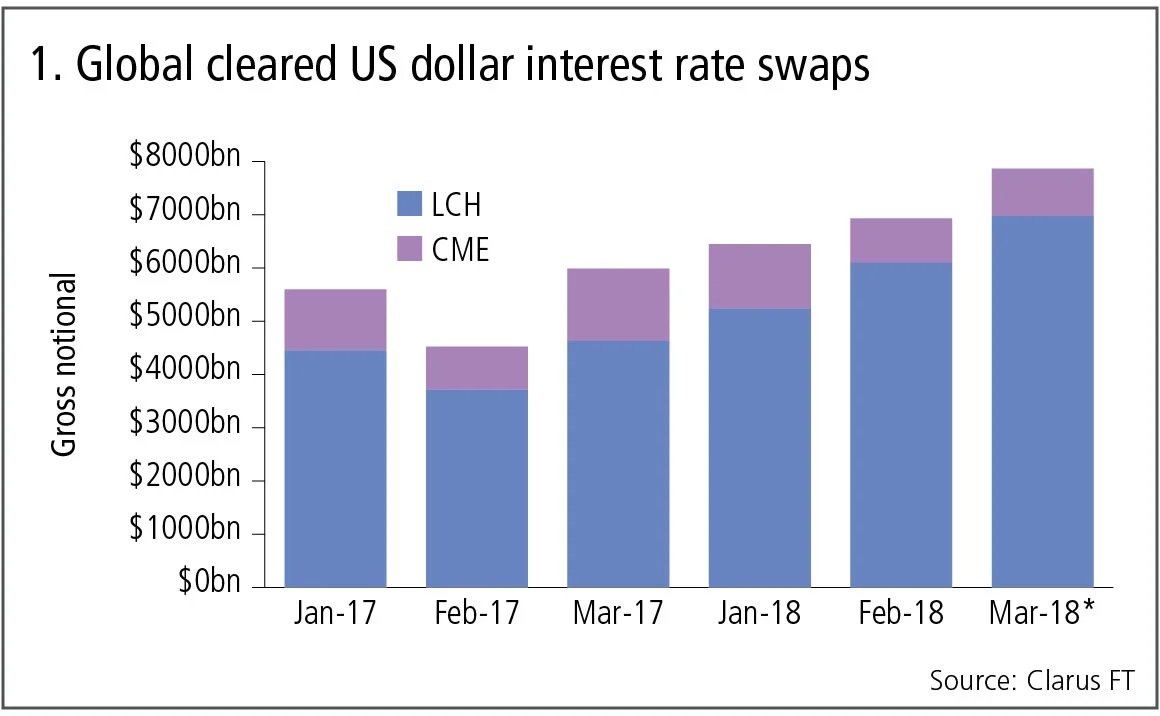
Figure 1 shows:
- Cumulative volume of $21 trillion gross notional in cleared US dollar interest rate swaps in Q1 2018, up a very healthy 32% from $16 trillion in Q1 2017.
- Volume increasing with each month in 2018.
- March 2018 figures, projected from three out of four weeks of data, look to be heading to a record volume month of $7.8 trillion.
- LCH SwapClear has increased market share from 80% in Q1 2017 to 86% in Q1 2018.
- So the cleared interest rate swap market continues to grow strongly, with exceptional volume growth at LCH SwapClear.
Swap execution facilities
Swap execution facilities (Sefs) are trading venues on which a subset of the cleared swaps executed by US-regulated market participants are required to be executed. Sefs publish their daily volumes, so let’s aggregate these for dealer-to-client and dealer-to-dealer Sefs for each month in Q1 2018 and compare with a year earlier.

Figure 2 shows:
- Cumulative volume of $9 trillion gross notional in cleared US dollar interest rate swaps in Q1 2018, up the same 32% from $7 trillion in Q1 2017, with volume increasing in each month in 2018.
- March 2018 figures, which I have projected from three out of four weeks of data, look to be heading to a record volume month of $3 trillion.
- Dealer-to-client Sefs (Bloomberg, Tradeweb and TrueEx) capturing most of the growth and increasing their market share to 70% in Q1 2018 from 63% a year earlier.
- Dealer-to-dealer Sefs (BGC, Dealerweb, TP Icap and Tradition) with similar volume in Q1 2018 to a year earlier.
The on-Sef $9 trillion of gross notional in Q1 2018 is 43% of the global cleared US dollar interest rate swap volume of $21 trillion.
So, where do we look for the remaining 57%?
First, we need to find US persons-cleared volume that is transacted off-Sef, which we know will be substantial as only spot-starting vanilla par swaps and the first two IMM and Mac swaps are mandated to be executed on a swap execution facility – meaning some common trades – such as forward-starting swaps, which are cleared – will be executed off-Sef.
Swap data repositories
US SDRs publish trade-level data for all over-the-counter derivatives traded by US persons and we can aggregate this data to get an insight into the volume of on-Sef vs off-Sef business and cleared vs uncleared trades.
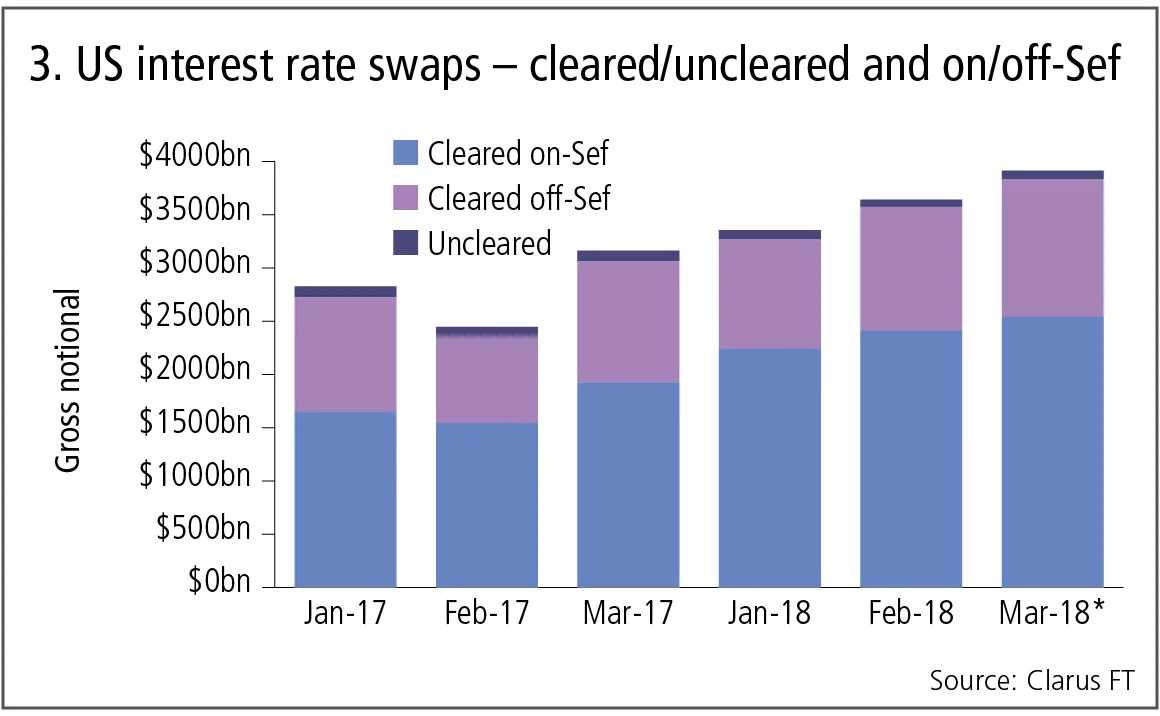
Figure 3 shows:
- Only a small amount of US dollar interest rate swaps is uncleared, averaging less than $80 billion in a month.
- Cleared on-Sef trades form the largest component, followed by cleared off-Sef trades.
- Q1 2018 SDR data shows $7.2 trillion of cleared on-Sef gross notional, which is less than the $9 trillion reported in the preceding chart by Sefs. The discrepancy is due to the capping of large trade notionals in SDR data so their true notionals are not shown – an attempt to protect market liquidity.
- Similarly, the $3.5 trillion in cleared off-Sef gross notional in Q1 2018 needs to be scaled up to $5 trillion.
Consequently, we can say that in Q1 2018, $9 trillion of cleared US dollar interest rate swaps were executed on-Sef and approximately $5 trillion of cleared US dollar interest rate swaps were executed off-Sef. The cumulative total of $14 trillion, represents 67% of the global cleared volume.
Where do we look for the remaining 33%?
European data
The obvious location is Europe and specifically London, where a significant number of swaps trading venues are located. As noted above, however, Mifid II has so far failed to deliver.
Trade repositories pre-date Mifid as far as derivatives are concerned, and they have been publishing daily data for a number of years. Unfortunately, due to double-sided reporting and to the highly aggregated nature of the data published, the public repository data is also largely meaningless and no use in understanding monthly volumes of US dollar swaps.
US dollar overnight index swaps
There is much talk and press on the transition away from Libor to new reference indexes so – while it is early days for the new Secured Overnight Financing Rate in the US – let’s take a look at the volumes of US dollar overnight index swaps (OIS) that use the Fed Funds rate.
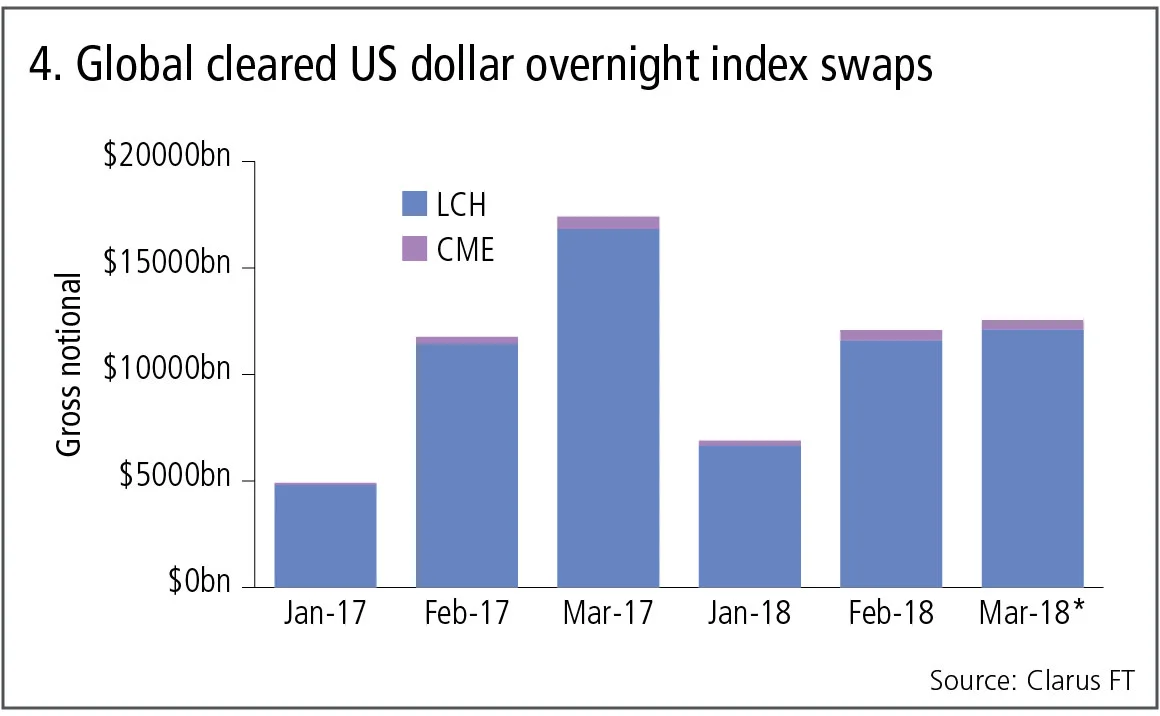
Figure 4 shows:
- Cumulative volume of $31 trillion gross notional in cleared US dollar overnight index swaps in Q1 2018, down 8% from the $35 trillion in Q1 2017, with March 2017 a record month.
- OIS volume is more than the $21 trillion gross notional in cleared US dollar swaps during Q1 2018.
OIS volumes may be eye-catching, but the overwhelming short maturities of this product, mean that when notional is converted into the DV01 risk measure, OIS swaps are dwarfed by swaps to the tune of $100 million DV01 in Q1 2018 compared with nearly $5 billion DV01.
This shows the challenge ahead for SOFR and other new reference rates positioning to replace Libor.
Amir Khwaja is chief executive of Clarus Financial Technology
Editing by Duncan Wood
Only users who have a paid subscription or are part of a corporate subscription are able to print or copy content.
To access these options, along with all other subscription benefits, please contact info@risk.net or view our subscription options here: http://subscriptions.risk.net/subscribe
You are currently unable to print this content. Please contact info@risk.net to find out more.
You are currently unable to copy this content. Please contact info@risk.net to find out more.
Copyright Infopro Digital Limited. All rights reserved.
As outlined in our terms and conditions, https://www.infopro-digital.com/terms-and-conditions/subscriptions/ (point 2.4), printing is limited to a single copy.
If you would like to purchase additional rights please email info@risk.net
Copyright Infopro Digital Limited. All rights reserved.
You may share this content using our article tools. As outlined in our terms and conditions, https://www.infopro-digital.com/terms-and-conditions/subscriptions/ (clause 2.4), an Authorised User may only make one copy of the materials for their own personal use. You must also comply with the restrictions in clause 2.5.
If you would like to purchase additional rights please email info@risk.net
More on Comment
G-Sib capital surcharge: how indexing and averaging alter incentives
Capital risk strategist anticipates Basel III endgame impact on US big-bank behaviour

Podcast: Abi-Jaber and Li on a ‘sticky’ volatility problem
The pair discuss their model to jointly capture Vix, SPX and SSR

Markets perceive the future in very distorted ways
Discounting paradigms should adapt to be more realistic, says Jean-Philippe Bouchaud

Op risk data: Cyber hacks shake crypto protocols
Also: JP Morgan fined over investor losses; Symetra’s Methodist pensions mess. Data by ORX News

Prediction markets can be a canary in the coal mine
Prices of contracts on the likes of Polymarket can act as signals for risk management and hedging, says risk expert

How AI agents can join the dots for risk managers
Citi risk expert outlines agentic AI tool that would pull together structured and unstructured data on trading and lending approvals to create single, unified view of risk

Op risk data: Corporate spies spell trouble for BBVA
Also: BofA buttonholed for alleged Epstein links; minority shareholders take a bite of Brookfield. Data by ORX News

The rise of AI politics
AI should not be treated as just another technology, writes MAS adviser David Hardoon
