Swaps data: third-quarter clearing volumes increase across all asset classes
Dollar and euro rates clearing surges 60% year on year, but little shift in CCP market share

The third quarter of 2019 has delivered growth in cleared over-the-counter derivatives volumes across all asset classes. Interest rate swaps in dollars and euros were the standout performers, with cleared volume jumping 60% compared with the same quarter a year earlier. Credit default swaps followed in a distant second place, with cleared volume for dollar-denominated instruments up by a third.
There’s also an encouraging trend in foreign exchange options clearing, adding to growth seen during second quarter. Forex options are now on track to become the first OTC options product to clear in material amounts relative to the bilateral market.
There are multiple drivers at play. Volumes in rates products remained elevated during the quarter, continuing a trend seen the previous quarter when activity jumped on rate cut signals from the Federal Reserve.
From the start of September, phase four implementation of initial margin rules brought a number of buy-side firms into scope for posting regulatory margin against their non-cleared exposures. It’s a trend that could gain further traction in a year’s time, when phase five brings hundreds more buy-side firms into scope for IM, making clearing a cost-effective alternative to bilateral markets for more participants.
While more contracts are being centrally cleared, there’s little change in market share between central counterparties (CCPs). One exception is JSCC’s share of yen swaps clearing. The Tokyo-based CCP continues to slowly chip away at rival LCH SwapClear, growing its share of the instruments by two percentage points in the third quarter. This adds to a one percentage point gain made in the second quarter and gives the Japanese CCP a slight lead over its London-based competitor.
There’s no let-up in LCH SwapClear’s dominant share in dollar and euro interest rate swaps. The latter is one to keep an eye on during the fourth quarter, as we expect Eurex Clearing to extend its share of the market.
Ice maintains its dominance in credit while LCH ForexClear leads in foreign exchange.
Cleared US dollar swaps
Let’s start with the largest product; cleared US dollar interest rate swaps. We include all clearable types – vanilla fixed versus float, overnight index, basis, zero coupon and variable notional – using single-sided gross notional volumes.
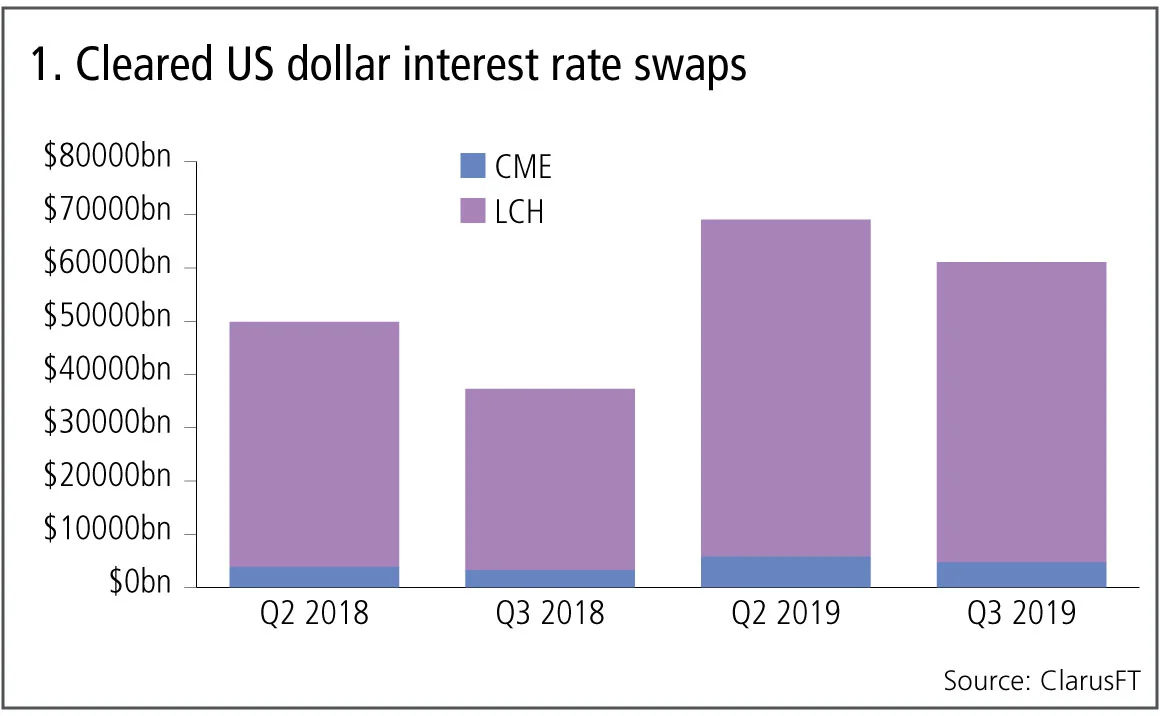
Figure 1 shows:
- Q3 2019 volumes at $61 trillion are 64% higher than a year earlier but 12% lower than Q2 2019.
- LCH SwapClear with 92% share in Q3 2019, the same as the prior quarter and CME with 8% share.
- LCH SwapClear is up $22 billion or 66% from a year earlier.
- CME is up $1.5 billion or 45% from a year earlier.
The increase in volumes seen in the second quarter, with the Federal Reserve signalling a cut in interest rates, continued to have an effect with elevated US dollar swap volumes in the third quarter.
Cleared euro swaps
Next the second-largest product; cleared euro interest rate swaps, all clearable types.
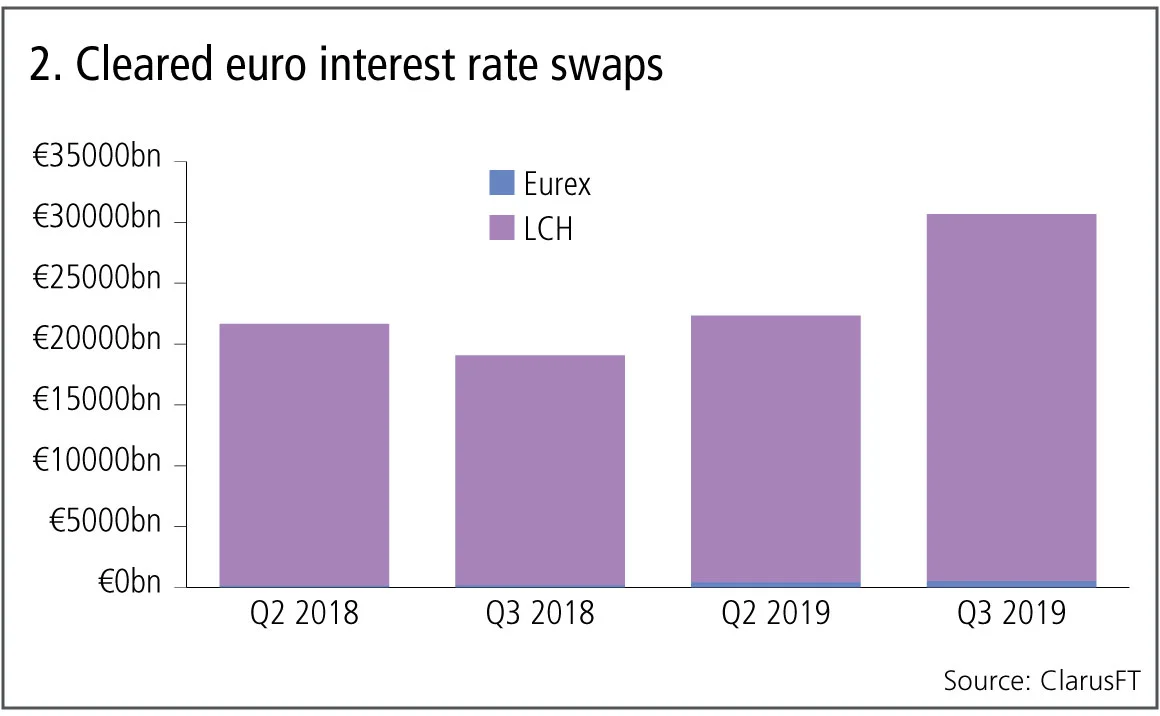
Figure 2 shows:
- Q3 2019 volumes at €31 trillion are 61% higher than a year earlier and 37% higher than Q2 2019.
- LCH SwapClear with 98.3% share in Q3 2019 and Eurex with 1.7%, little changed from Q2 2019.
- LCH SwapClear is up 60% or €11.3 trillion from a year earlier.
- Eurex is up 61% or €338 billion from a year earlier.
LCH SwapClear is continuing its dominance in euro swap volumes, with Eurex growing at a similar rate.
Cleared yen swaps
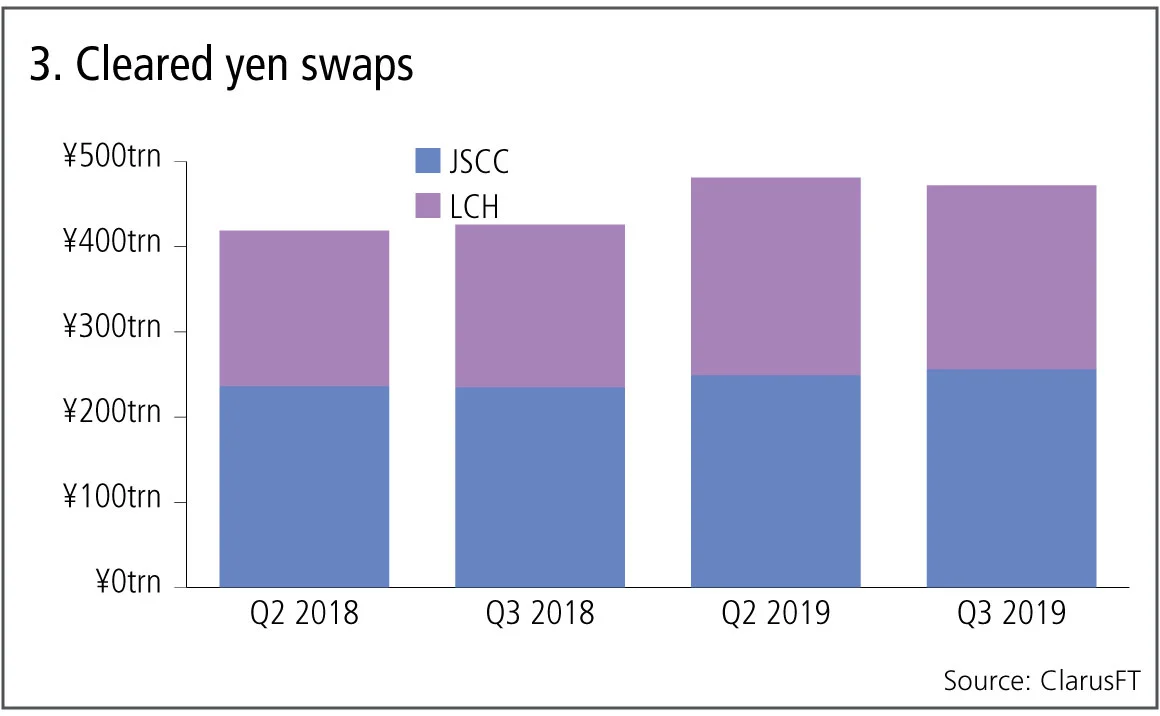
Figure 3 shows:
- Q3 2019 volumes at ¥472 trillion are 11% higher than a year earlier and 2% lower than Q2 2019.
- JSCC with 54% share and LCH SwapClear with 46% in Q3 2019, a gain of 2.4% in JSCC’s favour compared to Q2 2019.
- JSCC is up 9% or ¥21 trillion from a year earlier.
- LCH is up 13% or ¥35 trillion from a year earlier.
Market share in cleared yen swap volumes remains fairly evenly split between JSCC and LCH, but with signs of JSCC continuing to make low single-digit percentage gains over the last couple of quarters.
Cleared US dollar credit default swaps
Let’s now switch focus to credit derivatives and the volume of credit indexes and single names in US dollars.
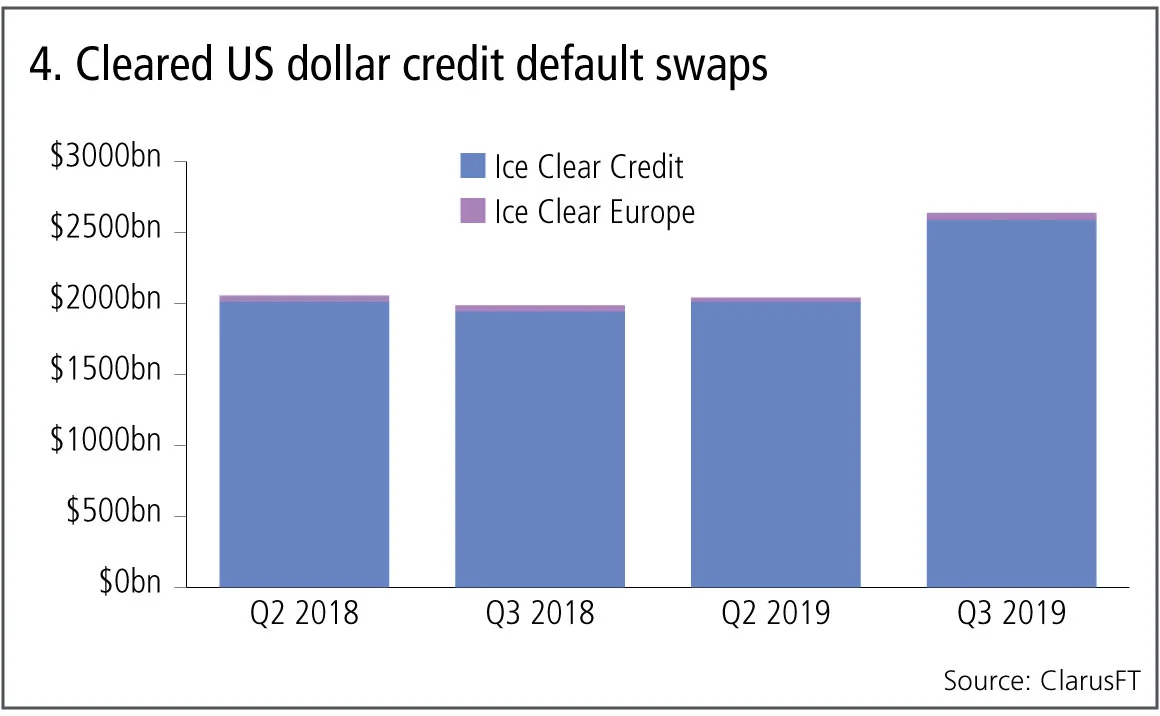
Figure 4 shows:
- Q3 2019 volumes at $2.6 trillion are up 33% from a year earlier and up 29% from Q2 2019.
- Ice Clear Credit dominates with 98% share.
Cleared euro credit default swaps
Next the volume of credit indexes and single names in euros.
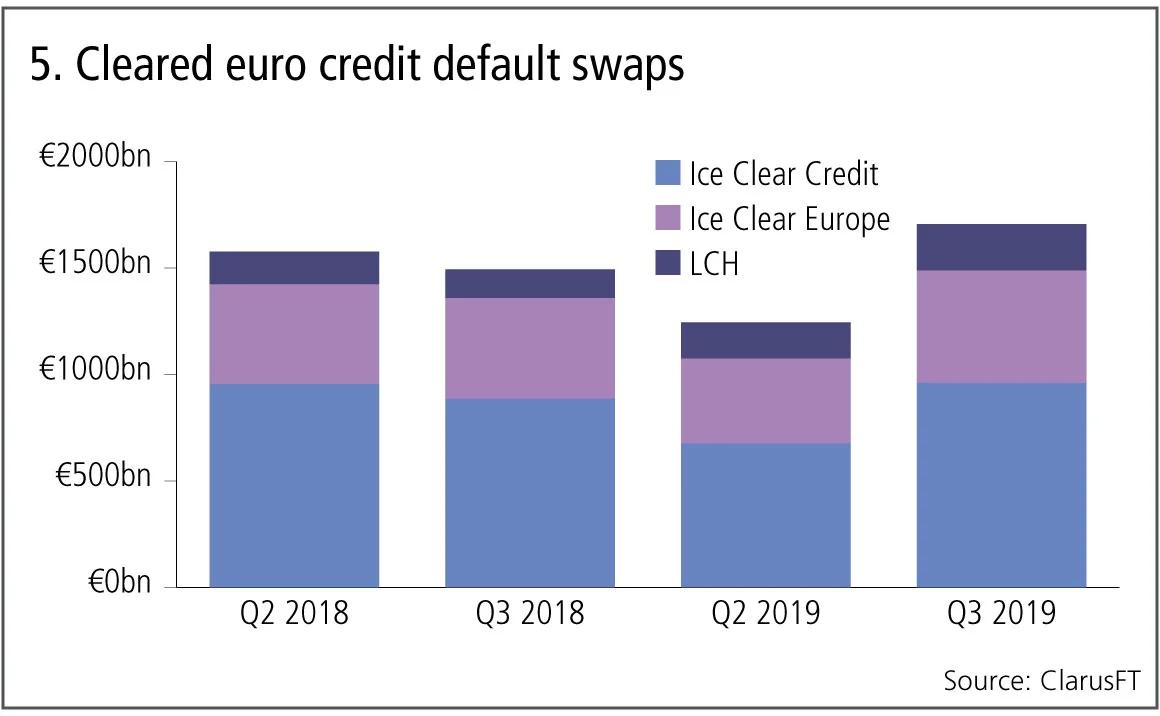
Figure 5 shows:
- Q3 2019 volumes at €1.7 trillion are 14% higher than a year earlier and 37% higher than Q2 2019.
- Ice Clear Credit with 56.3%, Ice Clear Europe 31.9% and LCH CDSClear with 12.8% market share in Q3 2019, which compares to 54.3%, 32.0% and 13.7% in Q2 2019.
- Ice Clear Credit is up 9% from a year earlier, Ice Clear Europe up 11% and LCH CDS Clear up 63%.
Cleared credit derivatives volumes in euros have grown year on year, but not as much as in US dollars. Ice Clear Credit is the largest by market share, though LCH CDSClear is growing at a faster rate, albeit from a lower base.
Cleared non-deliverable forwards
Finally, cleared non-deliverable forwards.
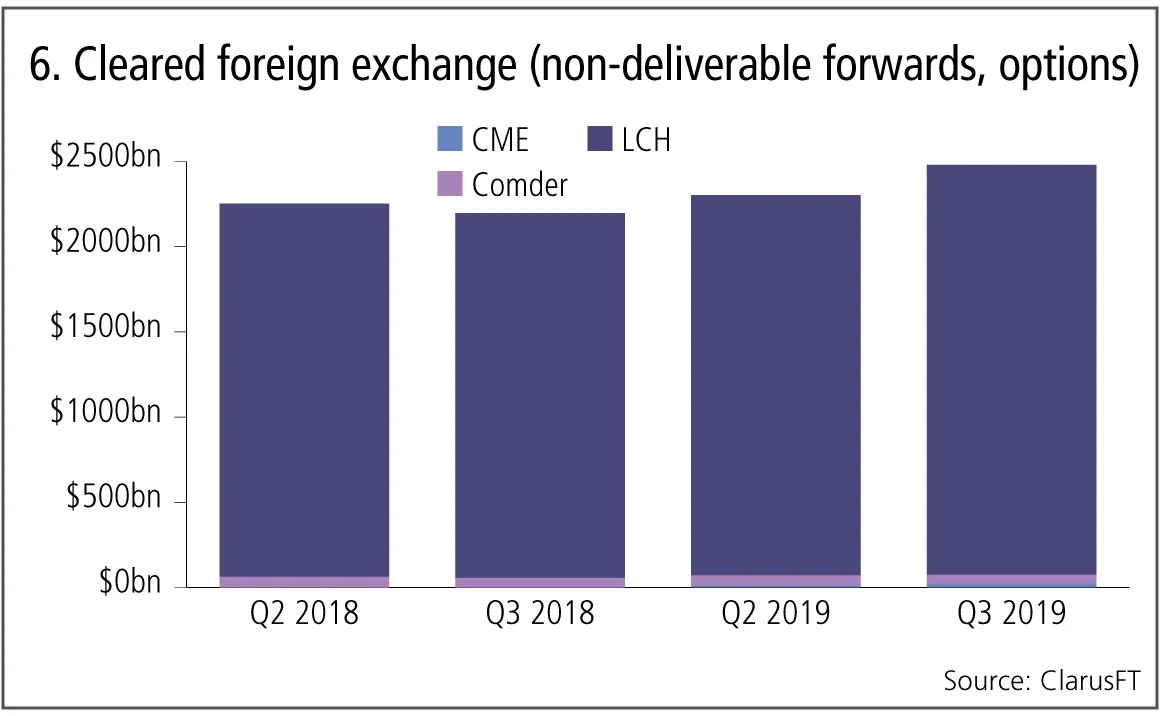
Figure 6 shows:
- Q3 2019 volumes at $2.5 trillion are 13% higher than a year earlier.
- LCH ForexClear with 97% share in the quarter.
- Chile’s Comder with 2.2% and CME with 0.9%.
Cleared non-deliverable forwards still growing but at lower rates than in, we may have to wait for uncleared margin rules phase five and six for a return to higher growth rates.
However delving further into the LCH ForexClear numbers, we do see very encouraging growth in forex options clearing with $25 billion gross notional in each of July and August 2019.
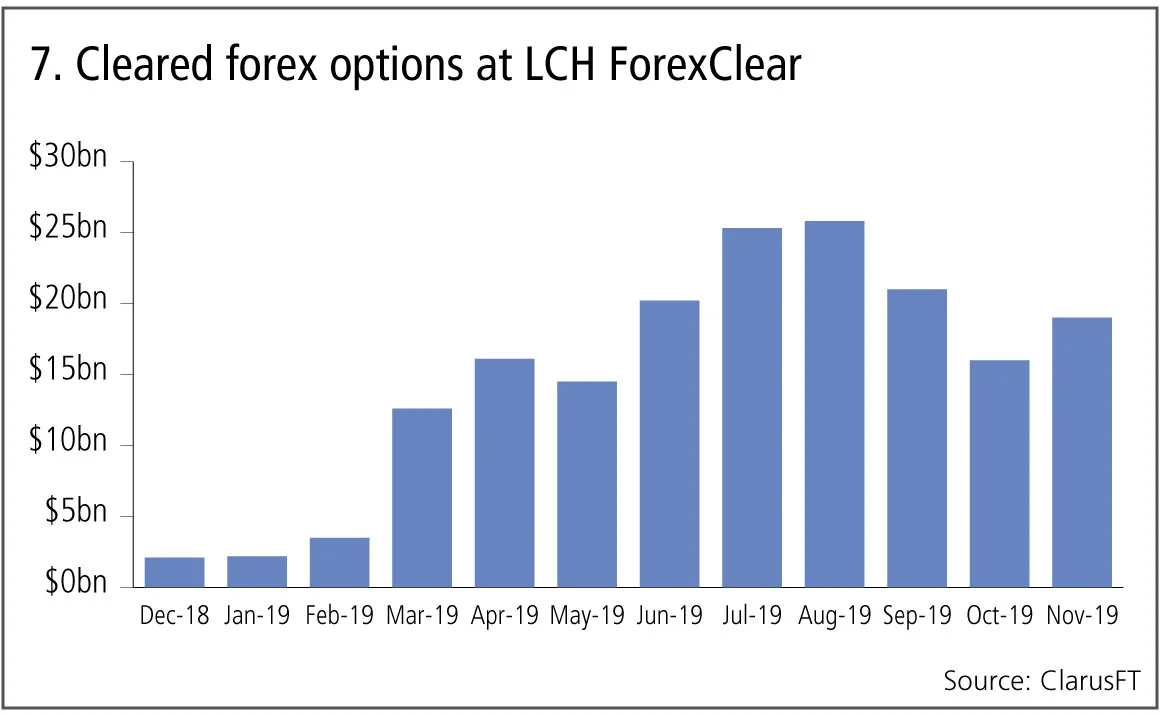
It will be interesting to see if forex options becomes the first OTC option product to clear in material amounts relative to the bilateral market. According to data from the Bank for International Settlements, gross notional outstanding in OTC forex options stood at $12.8 trillion at the half way point of 2019.
Amir Khwaja is chief executive of Clarus Financial Technology.
Only users who have a paid subscription or are part of a corporate subscription are able to print or copy content.
To access these options, along with all other subscription benefits, please contact info@risk.net or view our subscription options here: http://subscriptions.risk.net/subscribe
You are currently unable to print this content. Please contact info@risk.net to find out more.
You are currently unable to copy this content. Please contact info@risk.net to find out more.
Copyright Infopro Digital Limited. All rights reserved.
As outlined in our terms and conditions, https://www.infopro-digital.com/terms-and-conditions/subscriptions/ (point 2.4), printing is limited to a single copy.
If you would like to purchase additional rights please email info@risk.net
Copyright Infopro Digital Limited. All rights reserved.
You may share this content using our article tools. As outlined in our terms and conditions, https://www.infopro-digital.com/terms-and-conditions/subscriptions/ (clause 2.4), an Authorised User may only make one copy of the materials for their own personal use. You must also comply with the restrictions in clause 2.5.
If you would like to purchase additional rights please email info@risk.net
More on Comment
Italy’s spread problem is not (always) a credit story
Occasional doubts over Italy’s role in the monetary union adds political risk premium, argues economist

Markets never forget: the lasting impression of square-root impact
Jean-Philippe Bouchaud argues trade flows have a large and long-term effect on asset prices

Podcast: Pietro Rossi on credit ratings and volatility models
Stochastic approaches and calibration speed improve established models in credit and equity

Op risk data: Kaiser will helm half-billion-dollar payout for faking illness
Also: Loan collusion clobbers South Korean banks; AML fails at Saxo Bank and Santander. Data by ORX News

Beyond the hype, tokenisation can fix the pipework
Blockchain tech offers slicker and cheaper ops for illiquid assets, explains digital expert

Rethinking model validation for GenAI governance
A US model risk leader outlines how banks can recalibrate existing supervisory standards

Malkiel’s monkeys: a better benchmark for manager skill
A well-known experiment points to an alternative way to assess stock-picker performance, say iM Global Partner’s Luc Dumontier and Joan Serfaty

The state of IMA: great expectations meet reality
Latest trading book rules overhaul internal models approach, but most banks are opting out. Two risk experts explore why