Swaps data: CCP and Sef volumes still growing
First three quarters show strong growth in interest rate swaps, forex NDFs and index CDSs

With three quarters’ worth of swaps data now in, it’s a good chance to take stock of overall volumes and the competitive picture across a range of products and currencies. In short, the story is that volumes are growing, but not for all central counterparties (CCPs) and swap execution facilities (Sefs) – some are growing faster than others; some are down year-on-year.
Global cleared interest rate swaps
First let’s look at quarterly gross notional of interest rate swaps in major currencies – Australian dollar, Canadian dollar, euro, sterling, US dollar, yen – as reported by clearing houses.
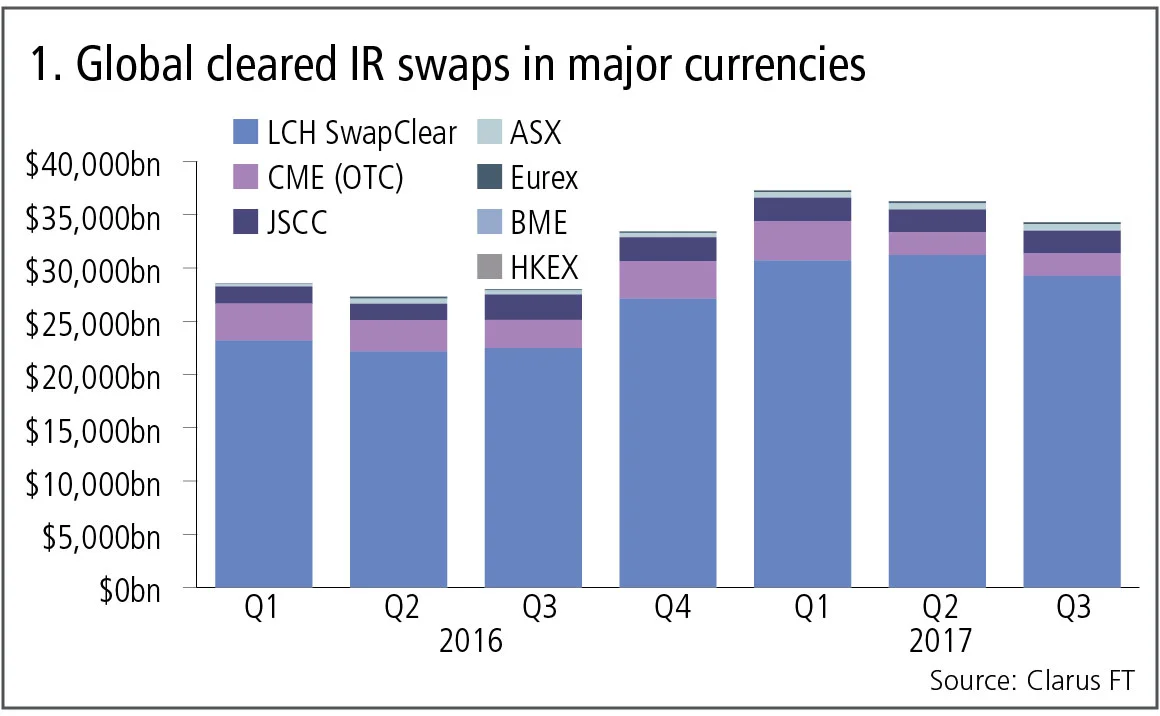
Figure 1 shows:
- Strong growth in 2017 over 2016, with each quarter higher than the corresponding quarter a year earlier.
- LCH SwapClear the largest with $29 trillion in the third quarter of 2017, up 30% year-on-year, and a year-to-date market share of 85% by gross notional.
- CME with $2 trillion in the third quarter of 2017, down 19% from the same period last year, and a year-to-date market share of 7%.
- The Japan Securities Clearing Corporation (JSCC) with $2 trillion in the third quarter, down 12% (in US dollar terms) from the third quarter in 2016 and a year-to-date market share of 6%.
- ASX with $620 billion in the third quarter, up 57% year-on-year (in US dollar terms) and a year-to-date market share of 2%.
- Eurex with $170 billion in the third quarter, up 107% (in dollar terms) from the same period a year earlier.
- Spain’s Bolsas y Mercados Espanoles (BME) with $700 million so far this year.
So the cleared interest rate swap market continues to grow, with a strong growth rate of 30% at the market leader LCH SwapClear, as well as exceptional growth from a lower base at ASX and Eurex, while both CME and JSCC are down in the most recent quarter from a year earlier.
US swap execution facilities
Next, volumes reported by US Sefs for interest rate swaps in the same six currencies.
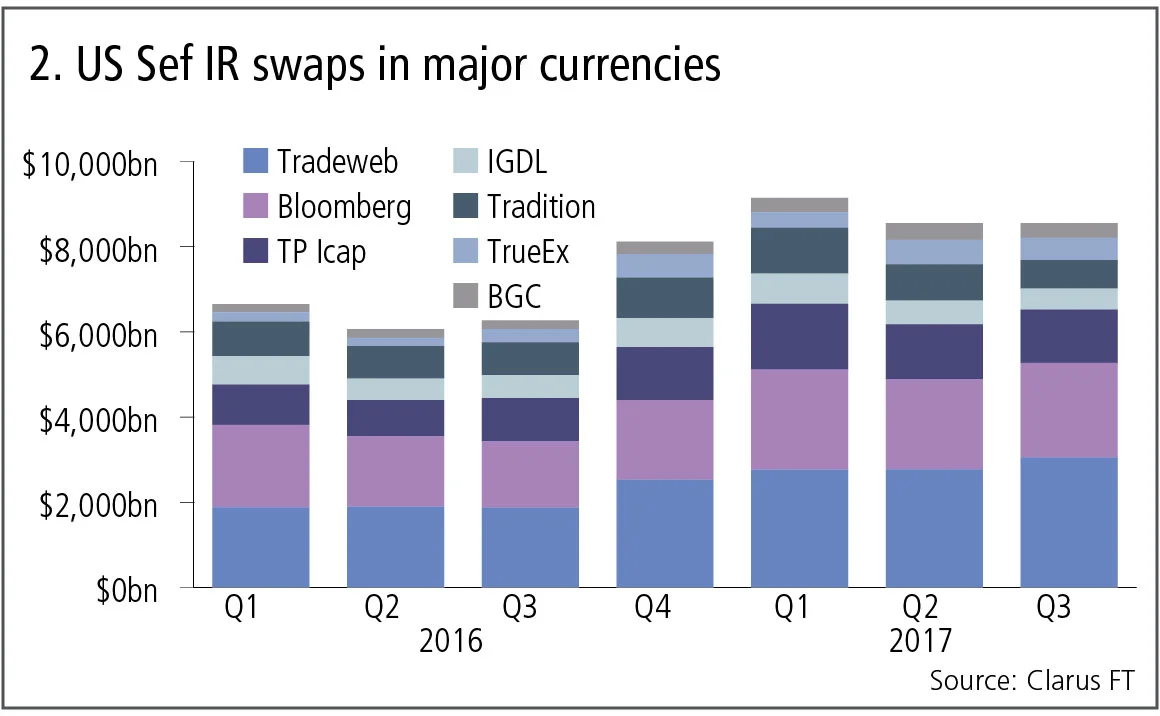
Figure 2 shows:
- Strong growth in 2017 over 2016, with each quarter higher than the corresponding quarter a year earlier.
- Tradeweb the largest with $3 trillion in the third quarter of 2017, up 63% from the same period last year, and a year-to-date market share of 33% by gross notional.
- Bloomberg with $2.2 trillion in the third quarter, up 42% from the third quarter in 2016 and a year-to-date market share of 25%.
- TP Icap is the largest interdealer player with $1.25 trillion in the third quarter, up 24% year-on-year, and a year-to-date share of 16%.
- IGDL, which is owned by TP Icap but managed separately, has $500 billion in the third quarter, down 9% from the same period last year, and a 7% year-to-date market share.
- Tradition with $670 billion in the third quarter, down 13% year-on-year, and a 10% year-to-date market share.
- TrueEx with $520 billion in the third quarter, up 67% from last year and a 6% year-to-date market share.
- BGC with $345 billion in the third quarter, up 73% year-on-year and a 4% year-to-date market share.
In summary, excellent growth at the three dealer-to-client Sefs: Bloomberg, Tradeweb and TrueEx, in part driven by portfolio maintenance compression and roll activity, with Tradeweb now established as the largest. For dealer-to-dealer Sefs, TP Icap is the leader with gains in the third quarter, while IGDL and Tradition are down during the period, possibly due to lower CME-LCH central counterparty switch volumes.
Interestingly, the cumulative volume reported by US Sefs in 2017 is $26 trillion and represents 24% of global cleared volume of $108 trillion.
Global cleared forex non-deliverable forwards
Cleared volumes for forex NDFs have benefited from the implementation of new margin rules for the non-cleared product, with volumes hitting new records.
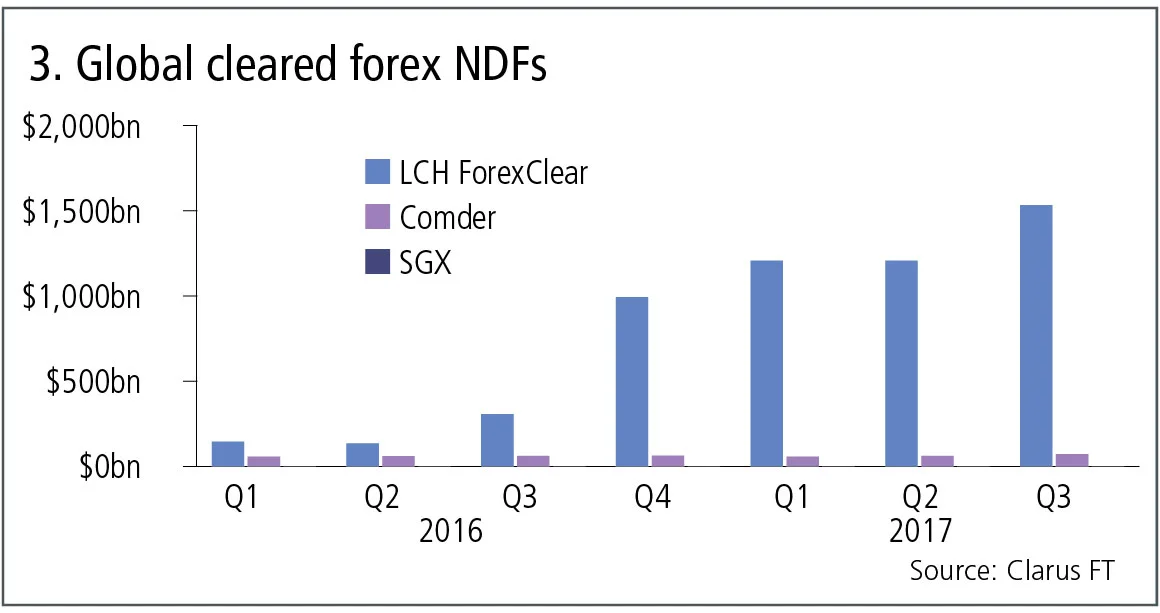
Figure 3 shows:
- LCH ForexClear with $1.5 trillion in the third quarter of 2017, up 400% from the same period last year, for a year-to-date market share of 95%.
- Comder with $73 billion in the third quarter, up 16% year-on-year, for a 5% share.
NDF volumes at US Sefs
US Sef volumes, however, do not show the same trend.
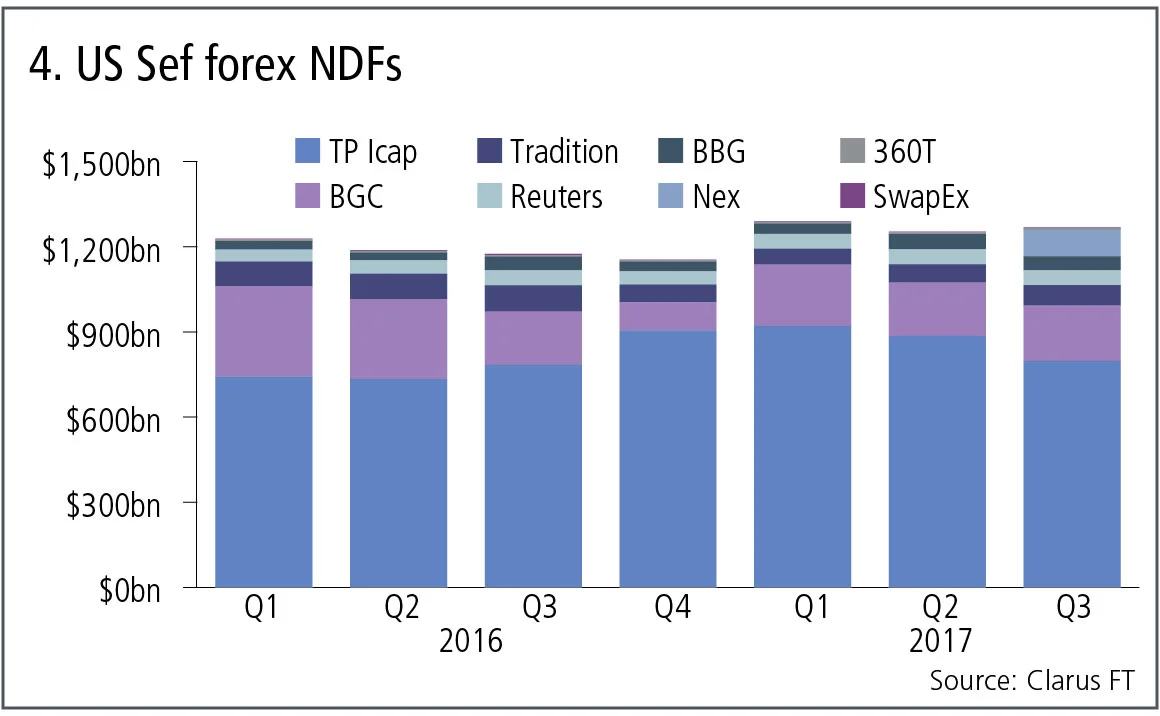
Figure 4 shows:
- Increases in 2017 but nothing like that seen for cleared volumes, which is due to the fact that clearing for NDFs happens post-trade and not at the point of execution, so the volumes here represent overall market activity, of which an increasing volume is now being cleared.
- The combination of TP Icap is the largest, with $800 billion in the third quarter this year.
- BGC is next with $194 billion in the third quarter.
- Nex started reporting in the most recent quarter.
The cumulative volume reported by US Sefs in 2017 is $3.8 trillion and equivalent to 92% of the global cleared volume of $4.1 trillion, which given there is significant NDF trading in Europe and Asia, suggests there is some way to go before cleared NDF volume growth slows down.
Global cleared CDS index
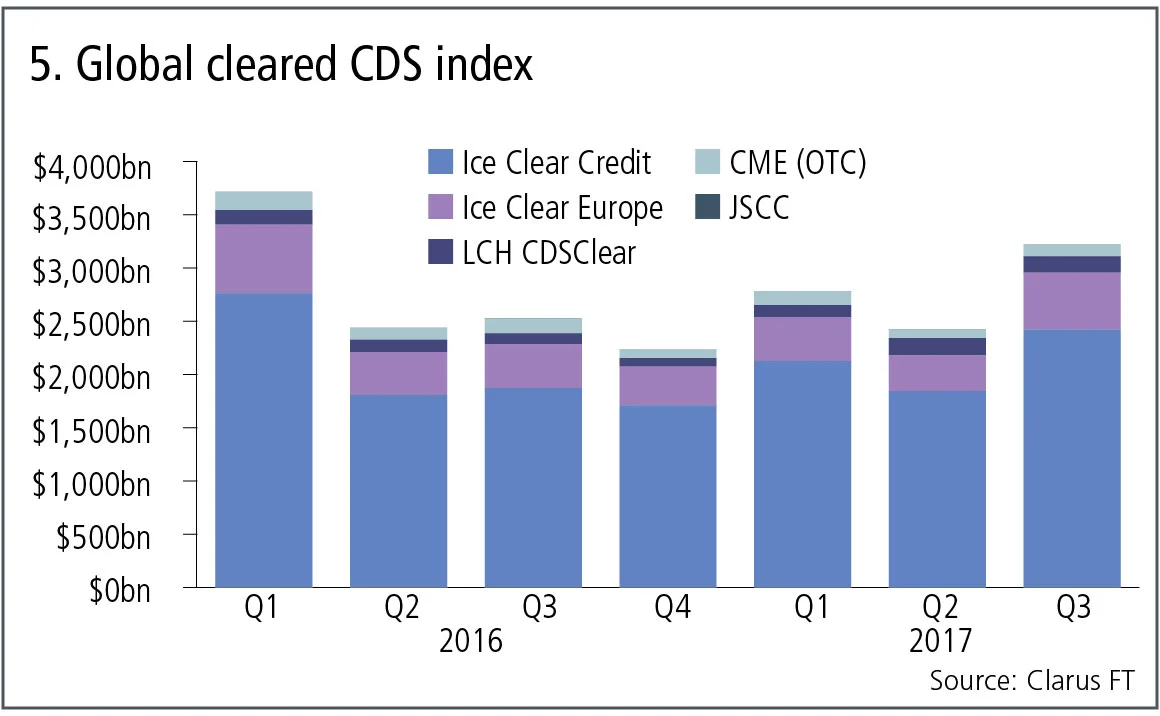
Figure 5 shows:
- Volumes for the third quarter of 2017 are up versus the same period in 2016, but previous quarters in 2017 were down.
- Ice Clear Credit is the largest clearer with $2.4 trillion in the third quarter, up 29% year-on-year for a year-to-date market share of 76%.
- Ice Clear Europe has $536 billion in the third quarter and is up 30% year-on-year.
- LCH CDSClear has $152 billion in the third quarter and is up 50% in dollar terms from the same period last year.
- CME has announced the closure of its CDS service and JSCC does not register on the chart.
In summary, strong growth from the market leader Ice, and strong growth from a lower base for LCH CDSClear.
CDS index volumes at US Sefs
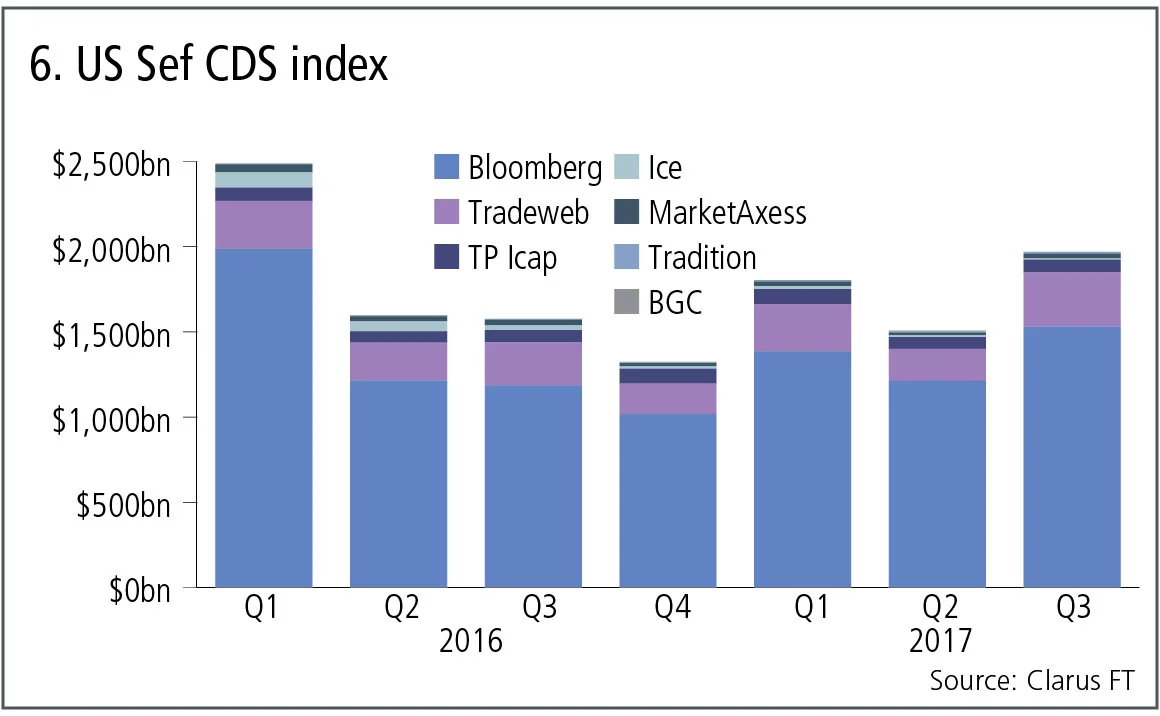
Figure 6 shows:
- A similar trend to figure 5, with the third quarter of 2017 up from the same period in 2016.
- Bloomberg by far the largest with $1.5 trillion in the third quarter, up 29% year-on-year and retaining the lion’s share of the market.
- Tradeweb is next with $318 billion in the third quarter, up 26% from last year for a year-to-date share of 15%.
- TP Icap combined with $72 billion in the third quarter, which is flat compared with the same period last year.
- The rest all barely adding to their small share of the market – meaning Bloomberg and Tradeweb are capturing all the growth.
Amir Khwaja is chief executive of Clarus Financial Technology.
Only users who have a paid subscription or are part of a corporate subscription are able to print or copy content.
To access these options, along with all other subscription benefits, please contact info@risk.net or view our subscription options here: http://subscriptions.risk.net/subscribe
You are currently unable to print this content. Please contact info@risk.net to find out more.
You are currently unable to copy this content. Please contact info@risk.net to find out more.
Copyright Infopro Digital Limited. All rights reserved.
As outlined in our terms and conditions, https://www.infopro-digital.com/terms-and-conditions/subscriptions/ (point 2.4), printing is limited to a single copy.
If you would like to purchase additional rights please email info@risk.net
Copyright Infopro Digital Limited. All rights reserved.
You may share this content using our article tools. As outlined in our terms and conditions, https://www.infopro-digital.com/terms-and-conditions/subscriptions/ (clause 2.4), an Authorised User may only make one copy of the materials for their own personal use. You must also comply with the restrictions in clause 2.5.
If you would like to purchase additional rights please email info@risk.net
More on Comment
Italy’s spread problem is not (always) a credit story
Occasional doubts over Italy’s role in the monetary union adds political risk premium, argues economist

Markets never forget: the lasting impression of square-root impact
Jean-Philippe Bouchaud argues trade flows have a large and long-term effect on asset prices

Podcast: Pietro Rossi on credit ratings and volatility models
Stochastic approaches and calibration speed improve established models in credit and equity

Op risk data: Kaiser will helm half-billion-dollar payout for faking illness
Also: Loan collusion clobbers South Korean banks; AML fails at Saxo Bank and Santander. Data by ORX News

Beyond the hype, tokenisation can fix the pipework
Blockchain tech offers slicker and cheaper ops for illiquid assets, explains digital expert

Rethinking model validation for GenAI governance
A US model risk leader outlines how banks can recalibrate existing supervisory standards

Malkiel’s monkeys: a better benchmark for manager skill
A well-known experiment points to an alternative way to assess stock-picker performance, say iM Global Partner’s Luc Dumontier and Joan Serfaty

The state of IMA: great expectations meet reality
Latest trading book rules overhaul internal models approach, but most banks are opting out. Two risk experts explore why