VAR versus expected shortfall
Value-at-risk is often criticised as not presenting a full picture of the risks a company faces. In the second of a series of articles explaining recent developments in risk management and derivatives pricing, John Hull discusses the limitations of VAR and the relative advantages of an alternative measure, expected shortfall

Value-at-risk is defined as the loss level that will not be exceeded with a certain confidence level during a certain period of time. For example, if a bank’s 10-day 99% VAR is \$3 million, there is considered to be only a 1% chance that losses will exceed \$3 million in 10 days. If we are going to use one measure describing the risk in a particular situation, is VAR the best choice? One problem with VAR is that, when used in an attempt to limit the risks taken by a trader, it can lead to undesirable results.
Suppose a bank tells a trader that the one-day 99% VAR of the trader’s portfolio must be kept less than $10 million. There is a danger that the trader will construct a portfolio where there is a 99% chance that the daily loss is less than \$10 million and a 1% chance that it is \$500 million. The trader is satisfying the risk limits imposed by the bank, but is clearly taking unacceptable risks. Most traders would, of course, not behave in this way – but some might.
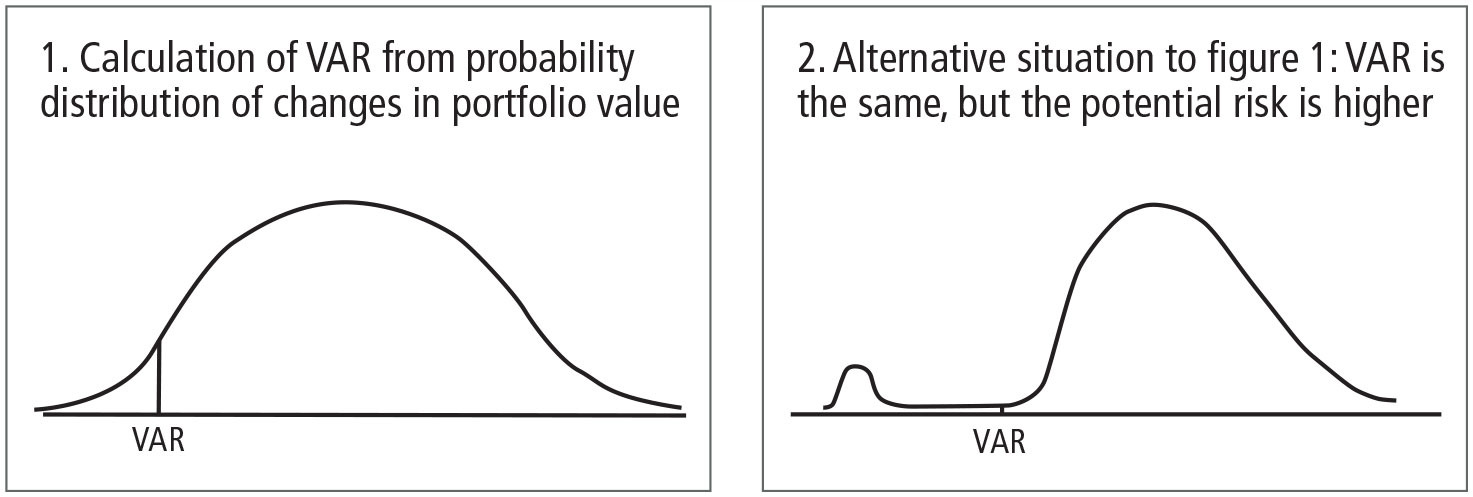
The problem here is summarised in figures 1 and 2. The figures show the probability distribution for the gain or loss on a portfolio over a specified period of time. Both portfolios have the same VAR. However, the portfolio in figure 2 is much riskier that the portfolio in figure 1 because potential losses are much larger.
Expected shortfall
A measure that produces better incentives for traders than VAR is expected shortfall. This is also sometimes referred to as conditional VAR, or tail loss. Where VAR asks the question ‘how bad can things get?’, expected shortfall asks ‘if things do get bad, what is our expected loss?’.
Expected shortfall, like VAR, is a function of two parameters: N (the time horizon in days) and X% (the confidence level). It is the expected loss during an N-day period, conditional that the loss is greater than the Xth percentile of the loss distribution. For example, with X = 99 and N = 10, the expected shortfall is the average amount that is lost over a 10-day period, assuming that the loss is greater than the 99th percentile of the loss distribution. Clearly, the expected shortfall is much higher in figure 2 than figure 1.
Properties of the risk measures
A risk measure that is used for specifying capital requirements can be thought of as the amount of cash (or capital) that must be added to a position to make its risk acceptable to regulators. Artzner et al (1999) have proposed a number of properties that such a risk measure should have. These are:
– Monotonicity: if a portfolio has lower returns than another portfolio for every state of the world, its risk measure should be greater.
– Translation invariance: if we add an amount of cash K to a portfolio, its risk measure should go down by K.
– Homogeneity: changing the size of a portfolio by a factor while keeping the relative amounts of different items in the portfolio the same should result in the risk measure being multiplied by .
– Sub-additivity: the risk measure for two portfolios after they have been merged should be no greater than the sum of their risk measures before they were merged.
The first three conditions are straightforward given that the risk measure is the amount of cash needed to be added to the portfolio to make its risk acceptable. The fourth condition states that diversification helps reduce risks. When we aggregate two risks, the total of the risk measures corresponding to the risks should either decrease or stay the same.
VAR satisfies the first three conditions, but it does not always satisfy the fourth, as will now be illustrated.
Consider two \$10 million one-year loans, each of which has a 1.25% chance of defaulting. If a default occurs on one of the loans, the recovery of the loan principal is uncertain, with all recoveries between 0% and 100% being equally likely. If the loan does not default, a profit of \$200,000 is made. To simplify matters, we suppose that if one loan defaults it is certain that the other loan will not default1. For a single loan, the one-year 99% VAR is \$2 million. This is because there is a 1.25% chance of a loss occurring, and conditional on a loss there is an 80% chance that the loss is greater than \$2 million. The unconditional probability that the loss is greater than \$2 million is 80% of 1.25%, or 1%.
Consider next the portfolio of two loans. Each loan defaults 1.25% of the time and they never default together. There is therefore a 2.5% probability that a default will occur. The VAR in this case turns out to be \$5.8 million. This is because there is a 2.5% chance of one of the loans defaulting, and conditional on this event there is a 40% chance that the loss on the loan that defaults is greater than \$6 million. The unconditional probability that the loss on the defaulting loan is greater than \$6 million is therefore 40% of 2.5%, or 1%. A profit of \$200,000 is made on the other loan, showing that the VAR is \$5.8 million.
The total VAR of the loans considered separately is \$2 million + \$2 million = \$4 million. The total VAR after they have been combined in the portfolio is \$1.8 million greater, at \$5.8 million. This is in spite of the fact that there are very attractive diversification benefits from combining the loans in a single portfolio.
Coherent risk measures
Risk measures satisfying all four conditions given above are referred to as coherent. The example illustrates that VAR is not always coherent. It does not satisfy the sub-additivity condition. This is not just a theoretical issue. Risk managers sometimes find that when the London portfolio is combined with that of New York to form a single portfolio for risk management purposes, the total VAR goes up rather than down.
In contrast, it can be shown that the expected shortfall measure is coherent. Consider again the earlier example. The VAR for a single loan is \$2 million. The expected shortfall from a single loan when the time horizon is one year and the confidence level is 99% is therefore the expected loss on the loan, conditional on a loss greater than \$2 million. Given that losses are uniformly distributed between zero and \$10 million, this is halfway between \$2 million and \$10 million, or \$6 million.
The VAR for a portfolio consisting of the two loans was calculated as \$5.8 million. The expected shortfall from the portfolio is therefore the expected loss on the portfolio, conditional on the loss being greater than \$5.8 million. When a loan defaults, the other (by assumption) does not, and outcomes are uniformly distributed between a gain of \$200,000 and a loss of \$9.8 million. The expected loss, given that we are in the part of the distribution between \$5.8 million and \$9.8 million, is \$7.8 million. This is therefore the expected shortfall on the portfolio. Because \$6 million + \$6 million > \$7.8 million, the expected shortfall does satisfy the sub-additivity condition for the example.
A risk measure can be characterised by the weights it assigns to quantiles of the loss distribution. VAR gives a 100% weighting to the Xth quantile and zero to other quantiles. Expected shortfall gives equal weight to all quantiles greater than the Xth quantile and zero weight to all quantiles below the Xth quantile. We can define what is known as a spectral risk measure by making other assumptions about the weights assigned to quantiles. A general result is that a spectral risk measure is coherent (that is, it satisfies the sub-additivity condition) if the weight assigned to the qth quantile of the loss distribution is a non-decreasing function of q. Expected shortfall satisfies this condition. VAR, however, does not because the weights assigned to quantiles greater than X are less than the weight assigned to the Xth quantile.
Conclusions
Regulators make extensive use of VAR and its importance as a risk measure is therefore unlikely to diminish. However, expected shortfall has a number of advantages over VAR. This has led many financial institutions to use it as a risk measure internally.
1 This is to simplify the calculations. If the loans default independently of each other so that two defaults can occur, the numbers are very slightly different, but the VAR of the portfolio is still greater than the sum of the VARs of the individual loans.
References
Artzner P, F Delbaen, J-M Eber and D Heath, 1999
Coherent measures of risk
Mathematical Finance 9(3), pages 203-228
Hull J, 2006
Risk management and financial institutions
Prentice Hall
This is an edited extract from John Hull’s book, Risk Management and Financial Institutions, published by Prentice Hall in 2006. John Hull is the Maple professor of derivatives and risk management at the Joseph L Rotman School of Management, University of Toronto.
Only users who have a paid subscription or are part of a corporate subscription are able to print or copy content.
To access these options, along with all other subscription benefits, please contact info@risk.net or view our subscription options here: http://subscriptions.risk.net/subscribe
You are currently unable to print this content. Please contact info@risk.net to find out more.
You are currently unable to copy this content. Please contact info@risk.net to find out more.
Copyright Infopro Digital Limited. All rights reserved.
As outlined in our terms and conditions, https://www.infopro-digital.com/terms-and-conditions/subscriptions/ (point 2.4), printing is limited to a single copy.
If you would like to purchase additional rights please email info@risk.net
Copyright Infopro Digital Limited. All rights reserved.
You may share this content using our article tools. As outlined in our terms and conditions, https://www.infopro-digital.com/terms-and-conditions/subscriptions/ (clause 2.4), an Authorised User may only make one copy of the materials for their own personal use. You must also comply with the restrictions in clause 2.5.
If you would like to purchase additional rights please email info@risk.net
More on Risk management
The loneliness of the model risk manager
Boards may see them as a drag on innovation; risk functions need to show they embrace efficiency

US Treasuries clearing: a new era
What will the SEC’s clearing mandate mean for your firm? Explore the latest updates and analysis around clearing models, collateral requirements, risk tools and market structure

Seven developments shaping US Treasury clearing
As the SEC’s US Treasury clearing mandate approaches, FICC is rolling out new access models, protections and risk tools to help market participants prepare for a broader move into central clearing

Fireside chat: Advancing FX clearing for safer settlement
Developments in FX clearing are supporting the creation of a safer, more scalable settlement infrastructure

FHLB Cincinnati explores AI to spot failing banks
Agentic model detects anomalies, monitors sentiment and drafts credit reports for analyst review

Iran strikes a stress test for CCP margin models
CME’s Span2 and Ice’s IRM2 are performing as advertised. The next few days could test their mettle

Most banks run physical climate scenarios beyond 2050
Risk Benchmarking data finds majority rely on geospatial asset mapping, while a third use third-party catastrophe models

Big banks love their climate vendors; small banks, not so much
Risk Benchmarking: Lenders with blue-chip loan books more likely to favour climate tools, research finds