Swaps data: how the market responded to Covid-19
Swap rates saw massive moves as volumes peaked, writes Amir Khwaja of ClarusFT

The Covid-19 pandemic sent swap markets on their wildest ride in more than a decade. As central banks slashed rates to contain the economic fallout, volumes surged, spreads widened and prices gapped. On some days, rates seesawed back and forth as a flight to safety turned into a dash for cash.
Adding to the pressure, a majority of traders were working from home or from back-up facilities during the height of the turmoil. It was the biggest test of market liquidity since the financial crisis, and the reforms that followed.
As the dust settles, we look at how the US dollar interest rate swaps market fared over this critical period in March 2020.
The month began with traders positioning for a rate cut, which came earlier than expected, on March 3. This spooked markets and accelerated the sell-off in risk assets. Cleared US dollar swap volumes, which averaged roughly $250 billion a day prior to February 18, swelled to a peak of $720 billion on March 4.
Volumes fell back to $400 billion to $450 billion a day before hitting a second peak of $600 billion on March 13, as traders positioned for a second rate cut. This came on Sunday, March 15, when the Fed cut its target rate to near zero. Daily volumes were in the $300 billion to $500 billion range for the remainder of the month.
Prices gyrated wildly over this period. The 30-year swap rate dropped 25 basis points on March 6 and 9, eight times the average daily move of plus or minus 3bp. Those were consecutive trading days – a Friday and a Monday – resulting in a 50bp drop over two days.
The intraday moves were also extraordinary. On March 6, the 30-year US dollar swap rate fell from above 1% to 0.86% at the London opening before rising to 0.98% at noon, falling again to 0.81% at 3pm, and then rising back up to 0.95% at 4pm.
There have been reports of market liquidity deteriorating and even seizing up during this volatile period.
My colleague Chris Barnes has some interesting analysis on this on the Clarus blog, which shows that while price dispersion in 10-year swaps tripled from the prior month, volumes were high and markets continued to function through even the most volatile periods.
These were rollercoaster days – kudos to those who navigated them successfully.
Cleared US dollar swaps
First, we’ll look at daily volumes of cleared vanilla US dollar interest rate swaps between February 18 and March 27, 2020.
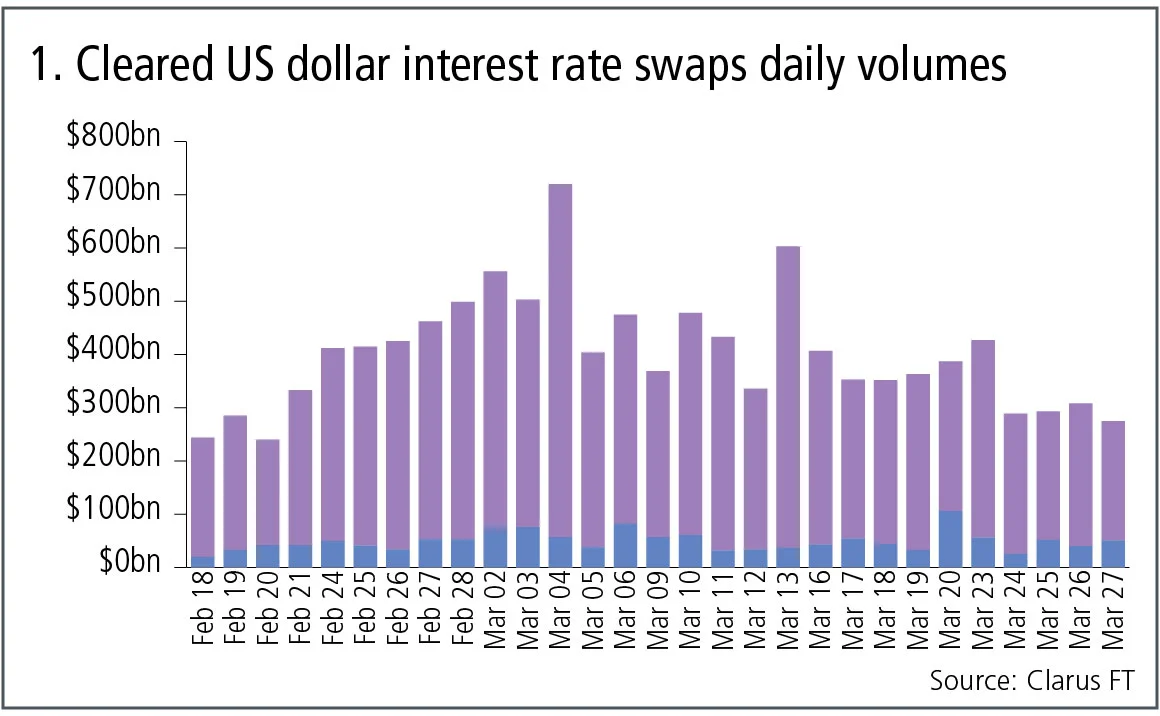
Figure 1 shows:
- Daily gross notional cleared at CME and LCH. Prior to February 18, volumes averaged roughly $250 billion a day.
- From February 21 onwards, we see a steady rise in volumes as participants positioned themselves in the expectation that the Federal Reserve would lower rates.
- After the Federal Reserve’s first emergency rate cut on March 3, US dollar swaps volumes surged to a peak of $720 billion in gross notional terms on March 4.
- After falling back down to late February levels of $400 billion to $450 billion a day, volumes surged again to a second peak of $600 billion on Friday, March 13, ahead of the Fed’s second emergency rate cut on Sunday, March 15.
- Daily volumes remained elevated in the $300 billion to $500 billion range for the remainder of the month.
Maturity tenors
Next, let’s break down the daily volumes for LCH SwapClear by tenor bucket for the same period.
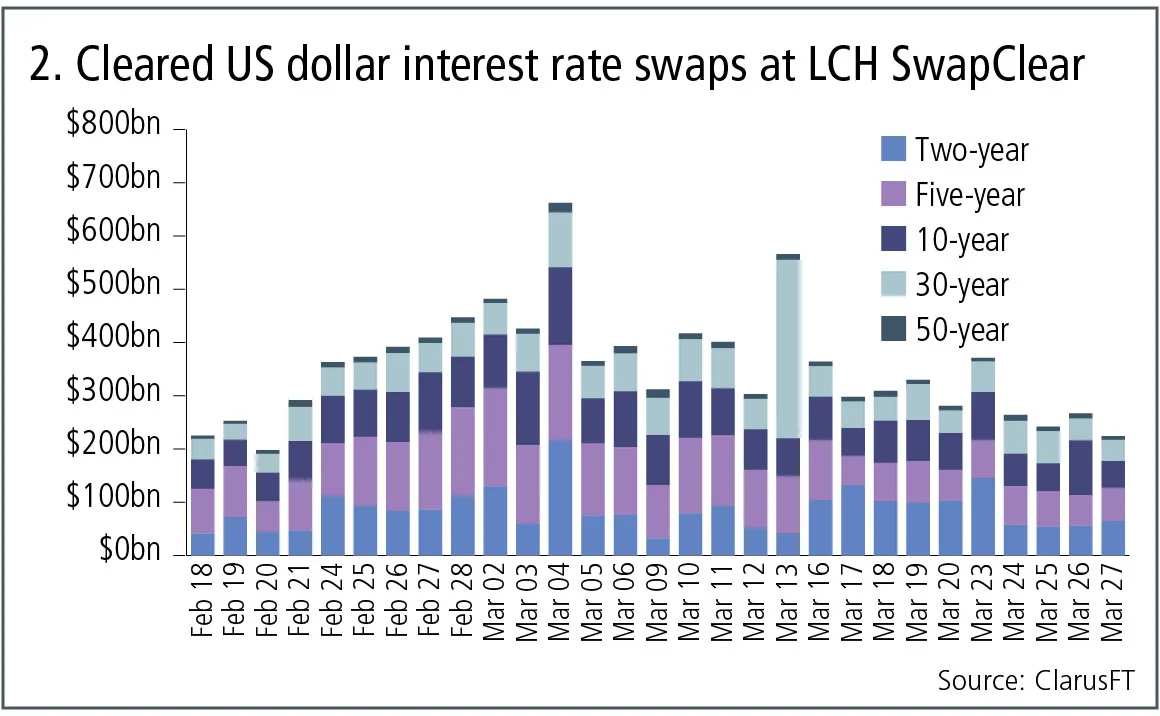
Figure 2 shows:
- On March 4, sub two-year volumes jumped massively to $217 billion, from $60 billion the day before.
- In fact, on March 4, all tenor buckets were at or close to their daily highs, with the 10-year at $146 billion and the 30-year at a massive $103 billion, far higher in gross DV01 terms than the two-year volume.
- On March 13, we see a massive $335 billion of gross notional traded in 30-year swaps.
Price changes
Next, we look at price moves over this period.
Table A shows:
- The six days in March with the largest price moves.
- We calculated the volume-weighted average price of actual trades seen on each day up to 3pm EST and then compared it with the prior day, giving us a robust transaction base measure.
- The two-year saw its largest move of -16bp on March, which corresponds with the peak in two-year volumes.
- On March 6 and 9, we see massive -25bp drops in the 30-year. The average daily move is within +/- 3bp, so this is eight times a normal day. And with these being consecutive business days (Friday and Monday), we have a -50bp drop over two days.
- On March 13, swap rates rallied against the trend with sharp increases of up to +17bp, which coincided with, or resulted in, the jump in volumes on this day, especially in the 30-year.
In addition to large one-day changes, there were also large intra-day moves as the market digested and responded to news about the actions taken by central banks and governments to combat the pandemic’s impact on the economy.
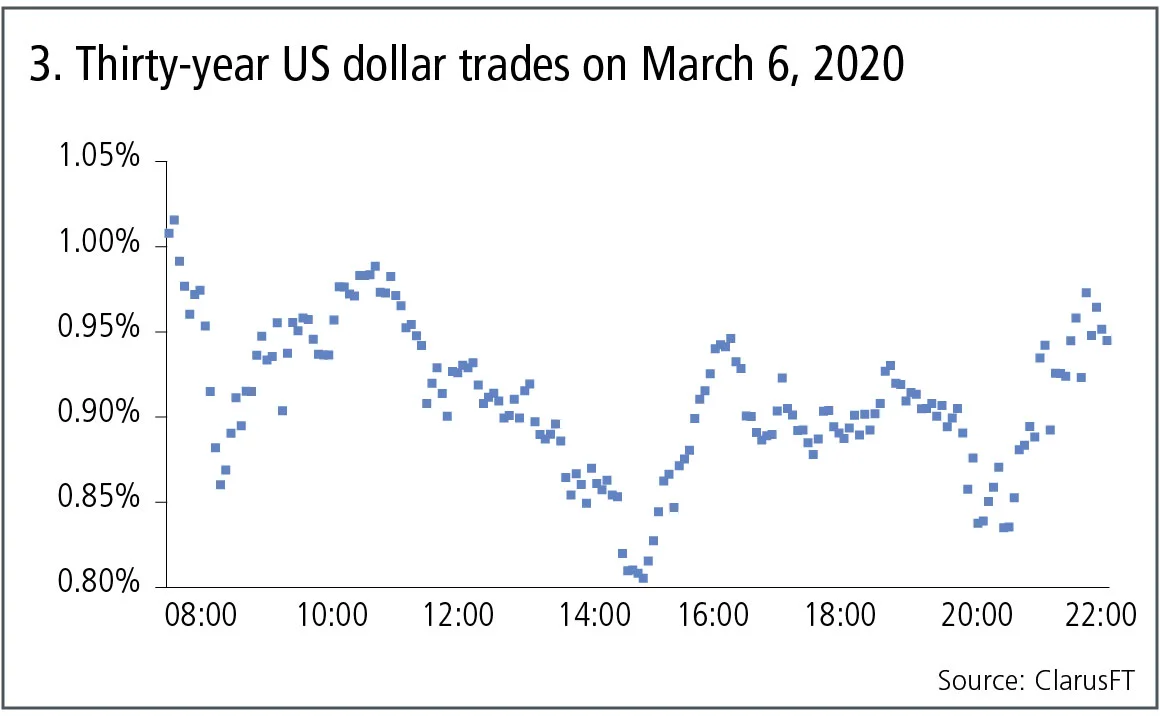
Figure 3 shows:
- The actual prices of 30-year US dollar swaps trades between 7:30 and 22:00 London time.
- First, we see rates dropping from above 1% to 0.86% at London opening and then going back up to 0.98% at 12 noon in London.
- Rates fall again as New York starts trading, all the way down to 0.805% at 3pm London, 11am New York.
- There is a sharp jump back up to 0.946% at 4pm London time.
- Rates drift down to 0.9% at 7pm and then drop sharply again to 0.835% at 7:47pm.
- And then up again to 0.95% at 9.30pm London time or 5:30 pm New York.
Monthly volumes
Let’s now step back and look at volumes in March 2020 compared with both the prior month and the prior year.
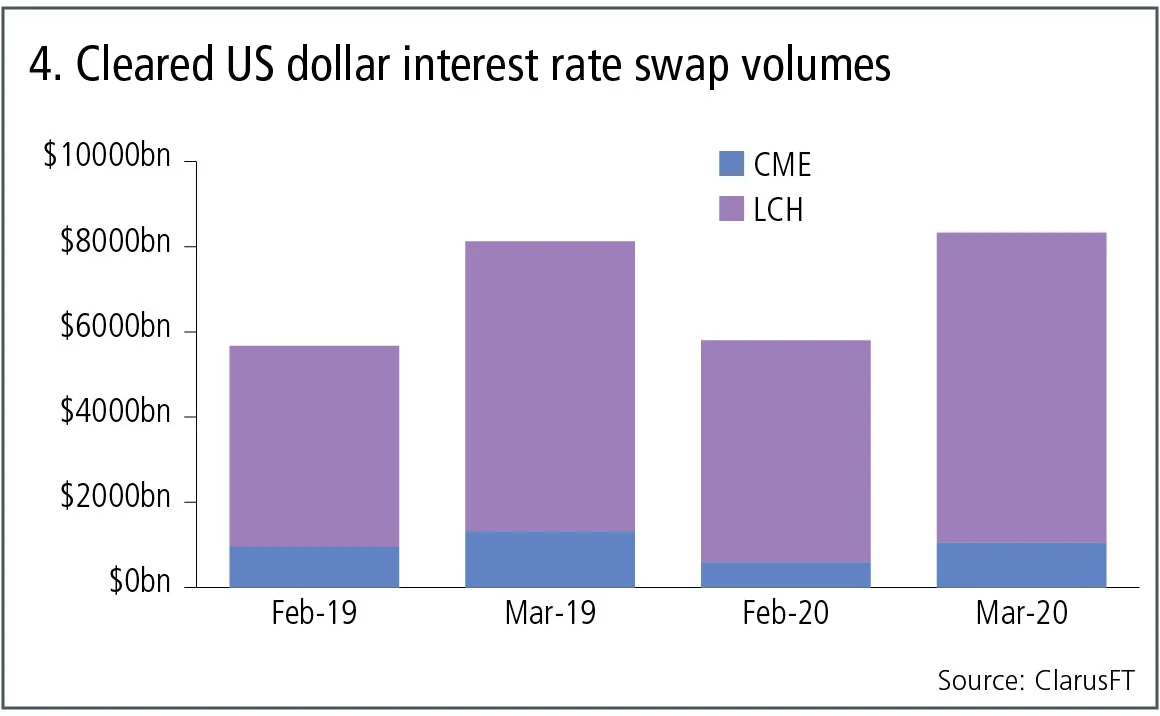
Figure 4 shows:
- March 2020 volumes at $8.3 trillion are slightly higher than for March 2019 and significantly higher than the $5.8 trillion in February 2020.
Cleared overnight index swaps
So far, we have focused on US dollar swaps, which reference Libor and are the largest in terms of risk traded. However, overnight index swaps (OIS) also see massive volumes – in particular, those that reference the Fed funds rate, which are mostly traded around Federal Open Market Committee meetings date decisions.
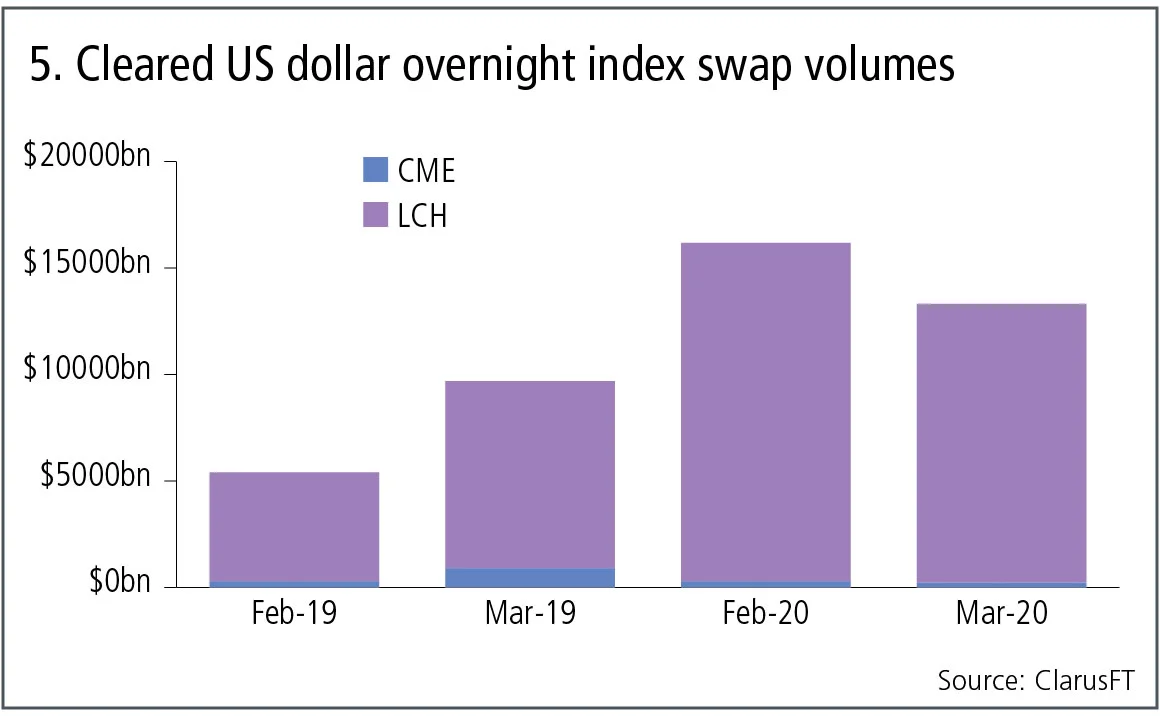
Figure 5 shows:
- February 2020 was a massive month, with $16.2 trillion of OIS.
- March 2020 was also a huge month, with $13.3 trillion gross notional.
- Both months are far higher than the corresponding months in 2019.
And finally, let’s look at daily gross notional for the February 18 to March 27 period.
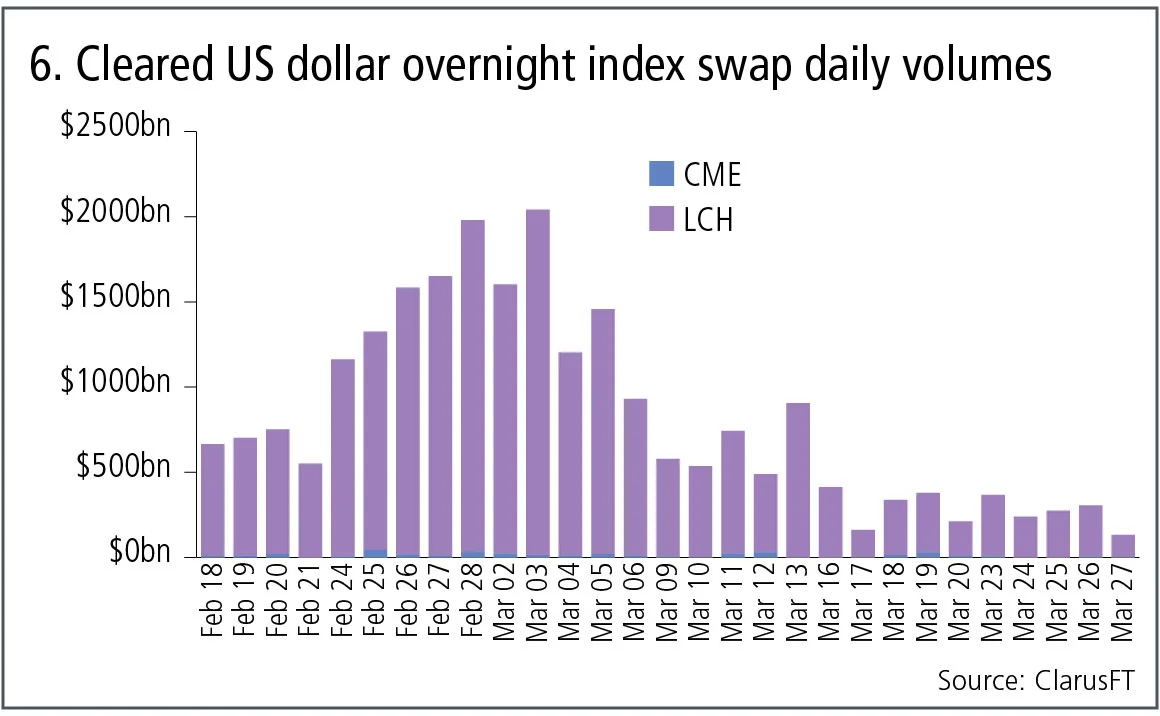
Figure 6 shows:
- Prior to February 18, volumes averaged roughly $400 billion a day.
- From February 24 onwards, we see a day-on-day rise in volumes as participants positioned themselves for the Federal Reserve to lower rates.
- We see a first peak of $1.98 trillion on February 28.
- And then on March 3, the date of the emergency rate cut, a new peak of $2.05 trillion gross notional traded in a single day.
- Volumes fell back to usual levels subsequently, particularly after March 13.
That’s a lot of data and charts to take in. Hopefully, they provide interesting insight and colour into how one of the largest markets in the world – US dollar swaps – performed during one of the most extraordinary months in recent memory. Let’s hope April is a normal month – or at least a new normal.
Amir Khwaja is chief executive of Clarus Financial Technology
Only users who have a paid subscription or are part of a corporate subscription are able to print or copy content.
To access these options, along with all other subscription benefits, please contact info@risk.net or view our subscription options here: http://subscriptions.risk.net/subscribe
You are currently unable to print this content. Please contact info@risk.net to find out more.
You are currently unable to copy this content. Please contact info@risk.net to find out more.
Copyright Infopro Digital Limited. All rights reserved.
As outlined in our terms and conditions, https://www.infopro-digital.com/terms-and-conditions/subscriptions/ (point 2.4), printing is limited to a single copy.
If you would like to purchase additional rights please email info@risk.net
Copyright Infopro Digital Limited. All rights reserved.
You may share this content using our article tools. As outlined in our terms and conditions, https://www.infopro-digital.com/terms-and-conditions/subscriptions/ (clause 2.4), an Authorised User may only make one copy of the materials for their own personal use. You must also comply with the restrictions in clause 2.5.
If you would like to purchase additional rights please email info@risk.net
More on Comment
Op risk data: Corporate spies spell trouble for BBVA
Also: BofA buttonholed for alleged Epstein links; minority shareholders take a bite of Brookfield. Data by ORX News

The rise of AI politics
AI should not be treated as just another technology, writes MAS adviser David Hardoon

AI risk management and the shift to capability control
By reframing validation, banks can align innovation with regulatory demands and maintain robust risk discipline, argues risk manager

Tokenised commodities could help oil the machine
Shifting physical assets onto the blockchain eases collateral frictions, argues crypto expert

In the age of GenAI, why do we still need good models?
Jean-Philippe Bouchaud says models can guide artificial intelligence through regime shifts and away from overfitting

When trading speed outruns governance: the split-second control gap
A new form of light-driven electronics could be the next risk in market infrastructure, explains derivatives expert

What futures and options say about the cost of war
Spot prices reveal major disruption, futures indicate this will pass, options imply ongoing instability

For collateral, can TINA become TIA?
US Treasuries’ dominance as collateral in repo and derivatives is no longer set in stone, argues economist